dPULearn.compare_sets_negatives
- static dPULearn.compare_sets_negatives(list_labels, names_datasets=None, df_seq=None, remove_non_neg=True, return_upset_data=False)[source]
Create DataFrame for comparing sets of identified negatives.
Optionally, data format can be created for Upset Plots, which are useful for visualizing the intersection and unique elements across these sets.
Added in version 0.1.0.
- Parameters:
list_labels (array-like, shape (n_datasets,)) – List of dataset labels for samples in
Xobtained by thedPULearn.fit()method. Label values should be either 0 (identified negative), 1 (positive) or 2 (unlabeled). Must contain 0.names_datasets (list, optional) – List of dataset names corresponding to
list_labels.df_seq (pd.DataFrame, shape (n_samples, n_seq_info), optional) – DataFrame containing an
entrycolumn with unique protein identifiers and asequencecolumn with full protein sequences, for the entries corresponding to thelabelsoflist_labels.remove_non_neg (bool, default=True) – If
True, all rows are removed that do not contain identified negatives in any provided dataset.return_upset_data (bool, default=False) – Whether to return a DataFrame for Upset Plot (if
True) or for a general comparison of sets of negatives.
- Returns:
If
return_upset_data=False(default): Returns a pd.DataFrame (df_neg_comp) that combinesdf_seq(if provided) with a comparison of the negative sets for a general analysis.If
return_upset_data=True: Returns a pd.Series (upset_data) formatted for generating Upset Plots, containing group size information for the intersection and unique elements across the label sets.
- Return type:
pd.DataFrame or pd.Series
See also
dPULearn.fit()for details on how labels are generated.SequenceFeature.get_df_parts()for details on format ofdf_seq.Upset Plot documentation:
upsetplot.plot().
Examples
The
dPULearn().compare_sets_negatives()method facilitates the comparison of identified negative samples across datasets. Providing identified negatives represented by ‘0’ in thelist_labelsinput, it returns a DataFrame (typically nameddf_neg_comp) where each row is a sample and each column a dataset, indicating whether the sample is identified as a negative (True) or not (False) in the respective dataset:import aaanalysis as aa list_labels = [[1, 1, 0, 0, 2], [1, 1, 0, 2, 0], [1, 1, 2, 0, 0]] dpul = aa.dPULearn() df_neg_comp = dpul.compare_sets_negatives(list_labels=list_labels) aa.display_df(df_neg_comp)
Set 1 Set 2 Set 3 3 True True False 4 True False True 5 False True True By default, only rows containing at least one identified negative are returned. To return all rows, set
remove_non_neg=False:df_neg_comp = dpul.compare_sets_negatives(list_labels=list_labels, remove_non_neg=False) aa.display_df(df_neg_comp)
Set 1 Set 2 Set 3 1 False False False 2 False False False 3 True True False 4 True False True 5 False True True Names of the datasets can be provided by the
names_datasetsargument:names = ["Dataset 1", "Dataset 2", "Dataset 3"] df_neg_comp = dpul.compare_sets_negatives(list_labels=list_labels, names_datasets=names) aa.display_df(df_neg_comp)
Dataset 1 Dataset 2 Dataset 3 3 True True False 4 True False True 5 False True True A DataFrame with sequence information (
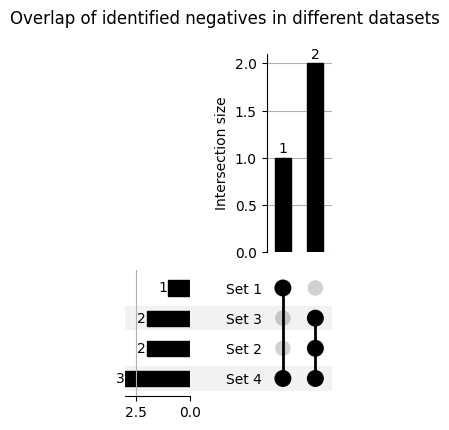
df_seq) and an required ‘entry’ column can be provdied, which is then merged with thedf_neg_compoutput DataFrame:import pandas as pd df_seq = pd.DataFrame([("entry1", "AA"), ("entry2", "BB"), ("entry3", "CC"), ("entry4", "DD"), ("entry5", "EE")], columns=["entry", "sequence"]) df_neg_comp = dpul.compare_sets_negatives(list_labels=list_labels, df_seq=df_seq) aa.display_df(df_neg_comp)entry sequence Set 1 Set 2 Set 3 3 entry3 CC True True False 4 entry4 DD True False True 5 entry5 EE False True True Such overlaps are conveniently visualized using Venn diagrams, but they are limited to a maximum of three datasets. For comparing more than three datasets, an Upset Plot is a better choice. To facilitate this, set
return_upset_data=Trueto generate a data structure directly compatible with the Upset Plot visualizations:from upsetplot import plot import matplotlib.pyplot as plt import warnings warnings.filterwarnings('ignore', category=FutureWarning) list_labels = [[1, 1, 0, 2, 2], [1, 1, 2, 0, 0], [1, 1, 2, 0, 0], [1, 1, 0, 0, 0]] upset_data = dpul.compare_sets_negatives(list_labels=list_labels, return_upset_data=True) plot(upset_data, show_counts='%d') plt.suptitle("Overlap of identified negatives in different datasets") plt.show()