NumericalFeature.filter_correlation
- static NumericalFeature.filter_correlation(X, max_cor=0.7)[source]
Filter features based on Pearson correlation.
Removes redundant columns from a feature matrix by iterating through features in order and discarding any feature that exceeds
max_corPearson correlation with an already-kept feature. Use this afterCPP.run()to reduce the selected feature set to a non-redundant subset.Added in version 0.1.0.
- Parameters:
X (array-like, shape (n_samples, n_features)) – Feature matrix. Rows typically correspond to proteins and columns to features.
max_cor (float, default=0.7) – Maximum Pearson correlation [0-1] of feature scales used as threshold for filtering.
- Returns:
1D boolean array with shape (n_features) indicating which features are selected (True) or not (False).
- Return type:
is_selected
Notes
Features in
Xshould be provided in decreasing order of importance. The first occurring features will be kept, while subsequent features that correlate with them will be removed.The number of selected features (
Trueentries) can be fewer thann_featureswhen redundant columns are removed; raisemax_corto retain more (admitting more redundancy).
Examples
To filter positively correlating features, you can use the
NumericalFeature.filter_correlation()method. We first load features to creat a feature matrix (X) using theDOM_GSECexample dataset (see [Breimann25]):import aaanalysis as aa aa.options["verbose"] = False df_seq = aa.load_dataset(name="DOM_GSEC") df_feat = aa.load_features() aa.display_df(df=df_feat, show_shape=True, n_rows=5) # Create feature matrix sf = aa.SequenceFeature() df_parts = sf.get_df_parts(df_seq=df_seq) X = sf.feature_matrix(features=df_feat["feature"], df_parts=df_parts)
DataFrame shape: (150, 15)
feature category subcategory scale_name scale_description abs_auc abs_mean_dif mean_dif std_test std_ref p_val_mann_whitney p_val_fdr_bh positions feat_importance feat_importance_std 1 TMD_C_JMD_C-Seg...3,4)-KLEP840101 Energy Charge Charge Net charge (Kle...n et al., 1984) 0.244000 0.103666 0.103666 0.106692 0.110506 0.000000 0.000000 31,32,33,34,35 0.970400 1.438918 2 TMD_C_JMD_C-Seg...3,4)-FINA910104 Conformation α-helix (C-cap) α-helix termination Helix terminati...n et al., 1991) 0.243000 0.085064 0.085064 0.098774 0.096946 0.000000 0.000000 31,32,33,34,35 0.000000 0.000000 3 TMD_C_JMD_C-Seg...6,9)-LEVM760105 Shape Side chain length Side chain length Radius of gyrat... (Levitt, 1976) 0.233000 0.137044 0.137044 0.161683 0.176964 0.000000 0.000001 32,33 1.554800 2.109848 4 TMD_C_JMD_C-Seg...3,4)-HUTJ700102 Energy Entropy Entropy Absolute entrop...Hutchens, 1970) 0.229000 0.098224 0.098224 0.106865 0.124608 0.000000 0.000001 31,32,33,34,35 3.111200 3.109955 5 TMD_C_JMD_C-Seg...6,9)-RADA880106 ASA/Volume Volume Accessible surface area (ASA) Accessible surf...olfenden, 1988) 0.223000 0.095071 0.095071 0.114758 0.132829 0.000000 0.000002 32,33 0.000000 0.000000 Providing
Xas positional argument, theNumericalFeature.filter_correlation()method will return a 1D boolean array calledis_selected:# Filter features nf = aa.NumericalFeature() is_selected = nf.filter_correlation(X) n = sum(is_selected) print(f"{n} features were selected") print(is_selected[0:5])
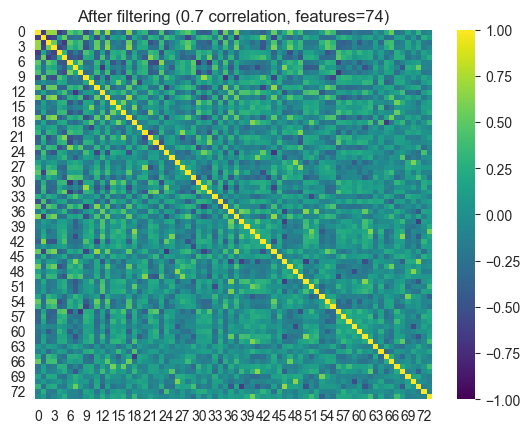
74 features were selected
[ True False False False False]
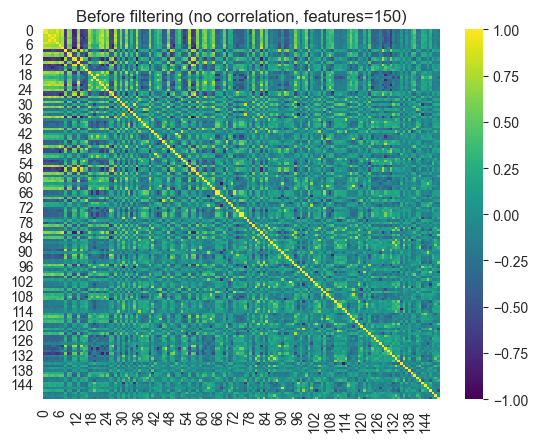
We can use
is_selectto obtain a filtered feature matrix:import pandas as pd import seaborn as sns import matplotlib.pyplot as plt # Create filtered feature matrix X_filter = X.T[is_selected].T # Show filtering effect sns.heatmap(data=pd.DataFrame(X).corr(), cmap="viridis", vmin=-1) plt.title(f"Before filtering (no correlation, features={X.shape[1]})") plt.show() plt.title(f"After filtering (0.7 correlation, features={X_filter.shape[1]})") sns.heatmap(data=pd.DataFrame(X_filter).corr(), cmap="viridis", vmin=-1) plt.show()
is_selectedan directly be used to filter the feature DataFrame:# Create filtered feature DataFrame df_feat_selected = df_feat[is_selected] aa.display_df(df=df_feat_selected, show_shape=True, n_rows=5)
DataFrame shape: (74, 15)
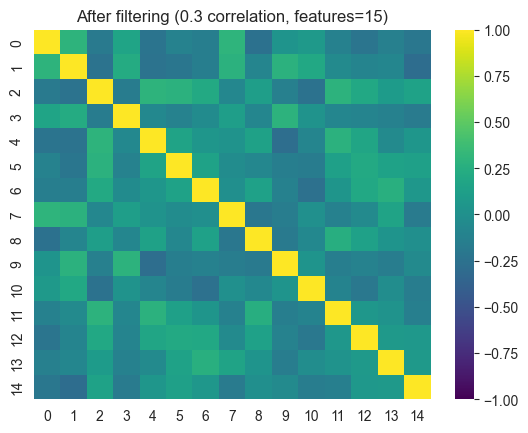
feature category subcategory scale_name scale_description abs_auc abs_mean_dif mean_dif std_test std_ref p_val_mann_whitney p_val_fdr_bh positions feat_importance feat_importance_std 1 TMD_C_JMD_C-Seg...3,4)-KLEP840101 Energy Charge Charge Net charge (Kle...n et al., 1984) 0.244000 0.103666 0.103666 0.106692 0.110506 0.000000 0.000000 31,32,33,34,35 0.970400 1.438918 9 TMD_C_JMD_C-Seg...,10)-WILM950103 Polarity Hydrophobicity (interface) Hydrophobicity (interface) Hydrophobicity ...e et al., 1995) 0.212000 0.141305 -0.141305 0.168603 0.217235 0.000000 0.000005 33,34 1.747200 2.150664 10 TMD_C_JMD_C-Seg...6,9)-AURR980110 Conformation α-helix α-helix (middle) Normalized posi...ora-Rose, 1998) 0.211000 0.125350 0.125350 0.160819 0.174121 0.000000 0.000005 32,33 1.788800 2.700803 14 TMD_C_JMD_C-Seg...4,5)-LEVM760105 Shape Side chain length Side chain length Radius of gyrat... (Levitt, 1976) 0.204000 0.105513 0.105513 0.132849 0.145219 0.000000 0.000009 33,34,35,36 1.992000 2.929460 16 TMD_C_JMD_C-Seg...3,4)-PRAM820102 Shape Shape and Surface Slope in Regression Slope in Regres...nnuswamy, 1982) 0.199000 0.073023 -0.073023 0.087336 0.107750 0.000000 0.000017 31,32,33,34,35 0.616000 0.847660 Decreasing the correlation threshold (
max_cor, default=0.7) will result in a stricter filtering and less selected features:is_selected = nf.filter_correlation(X, max_cor=0.3) # Create filtered feature matrix X_filter = X.T[is_selected].T # Show filtering effect plt.title(f"After filtering (0.3 correlation, features={X_filter.shape[1]})") sns.heatmap(data=pd.DataFrame(X_filter).corr(), cmap="viridis", vmin=-1) plt.show() # Create filtered feature DataFrame df_feat_selected = df_feat[is_selected] aa.display_df(df=df_feat_selected, show_shape=True, n_rows=5)
DataFrame shape: (15, 15)
feature category subcategory scale_name scale_description abs_auc abs_mean_dif mean_dif std_test std_ref p_val_mann_whitney p_val_fdr_bh positions feat_importance feat_importance_std 1 TMD_C_JMD_C-Seg...3,4)-KLEP840101 Energy Charge Charge Net charge (Kle...n et al., 1984) 0.244000 0.103666 0.103666 0.106692 0.110506 0.000000 0.000000 31,32,33,34,35 0.970400 1.438918 20 JMD_N_TMD_N-Seg...1,2)-KARP850101 Structure-Activity Flexibility Flexibility (0 ...igid neighbors) Flexibility par...s-Schulz, 1985) 0.196000 0.062671 0.062671 0.083456 0.090427 0.000000 0.000023 1,2,3,4,5,6,7,8,9,10 1.574400 1.835403 29 JMD_N_TMD_N-Pat...,10)-AURR980116 Conformation α-helix (C-cap) α-helix (C-terminal, C-cap) Normalized posi...ora-Rose, 1998) 0.184000 0.112728 -0.112728 0.166431 0.183800 0.000001 0.000061 11,15 0.857600 1.339550 63 TMD-Pattern(C,5...,12)-PRAM820102 Shape Shape and Surface Slope in Regression Slope in Regres...nnuswamy, 1982) 0.167000 0.077343 0.077343 0.135340 0.134263 0.000012 0.000228 19,22,26 1.301600 1.697263 88 JMD_N_TMD_N-Pat...,15)-RADA880106 ASA/Volume Volume Accessible surface area (ASA) Accessible surf...olfenden, 1988) 0.155000 0.059593 -0.059593 0.104862 0.110749 0.000050 0.000508 6,9,12,15 0.482000 0.672000