AAclust.comp_correlation
- static AAclust.comp_correlation(X, labels, X_ref=None, labels_ref=None, names=None, names_ref=None)[source]
Computes the Pearson correlation of given data with reference data.
Rows of
X(and optionallyX_ref) are sorted by their cluster labels before computing pairwise Pearson correlation, producing a labeled DataFrame suitable for visualisation withAAclustPlot.correlation()[Breimann24a].Added in version 0.1.0.
- Parameters:
X (array-like, shape (n_samples, n_features)) – Feature matrix. Rows typically correspond to scales and columns to amino acids.
labels (array-like, shape (n_samples,)) – Cluster labels for each sample in
X.X_ref (array-like, shape (n_samples, n_features)) – Feature matrix of reference data. If given, samples of
Xare compared with samples ofX_ref.labels_ref (array-like, shape (n_samples_ref,)) – Cluster labels for each sample in
X_ref.names (list of str, optional) – List of sample names corresponding to
X.names_ref (list of str, optional) – List of sample names corresponding to
X_ref.
- Returns:
df_corr (pd.DataFrame, shape (n_samples, n_samples or n_samples_ref)) – DataFrame with correlation either for each pair in
Xof shape (n_samples, n_samples) or for each pair betweenXandX_refof shape (n_samples, n_samples_ref).labels_sorted (array-like, shape (n_samples_ref,)) – Cluster labels for each sample and sorted as in df_corr.
Notes
Rows will be sorted in ascending order of
labels.Columns will be sorted in ascending order of
labelsorlabels_refif given.Labels are replaced by respective names if given.
See also
pandas.DataFrame.corr()used to compute the correlation.
Examples
To showcase the
AAclust().correlation()method, we create an example dataset:import aaanalysis as aa import seaborn as sns import matplotlib.pyplot as plt aa.options["verbose"] = False # Obtain example scale dataset df_scales = aa.load_scales(unclassified_out=True).T.sample(50).T df_cat = aa.load_scales(name="scales_cat") dict_scale_name = dict(zip(df_cat["scale_id"], df_cat["subcategory"])) names = [dict_scale_name[s] for s in list(df_scales)] X = df_scales.T # Fit AAclust model and retrieve labels aac = aa.AAclust() labels = aac.fit(X, n_clusters=10).labels_
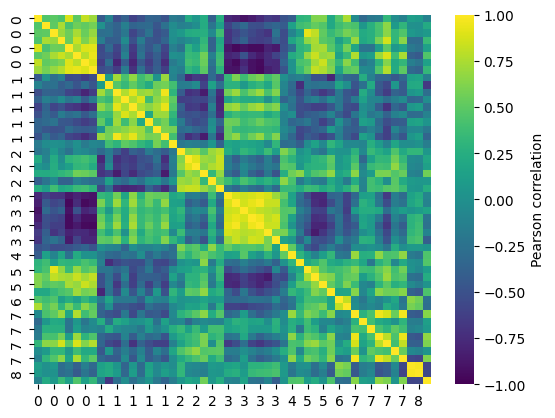
We now use the
AAclust().comp_correlation()method to compute the pairwise Pearson correlation across all scales provided as feature matrixXand sorted based on their clusteringlabels:df_corr, labels_sorted = aac.comp_correlation(X=X, labels=labels) # Visualize pairwise correlation by heatmap sns.heatmap(df_corr, vmax=1, vmin=-1, cmap="viridis", cbar_kws=dict(label="Pearson correlation")) plt.show()
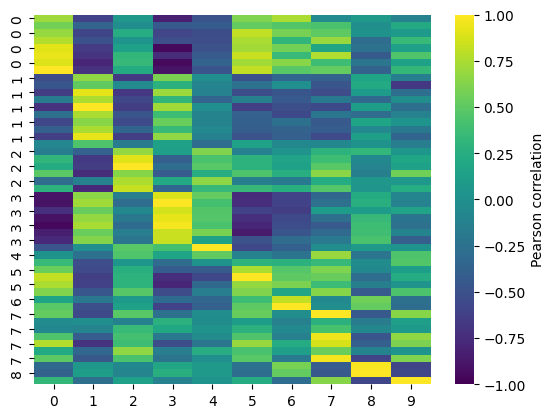
The correlation between the scales and the obtained cluster centers can be computing by providing additionally their feature matrix
X_refand labelslabels_ref:X_ref, labels_ref = aac.comp_medoids(X, labels=labels) df_corr, _ = aac.comp_correlation(X=X, labels=labels, X_ref=X_ref, labels_ref=labels_ref) # Visualize correlation between scales and cluster centers sns.heatmap(df_corr, vmax=1, vmin=-1, cmap="viridis", cbar_kws=dict(label="Pearson correlation")) plt.show()
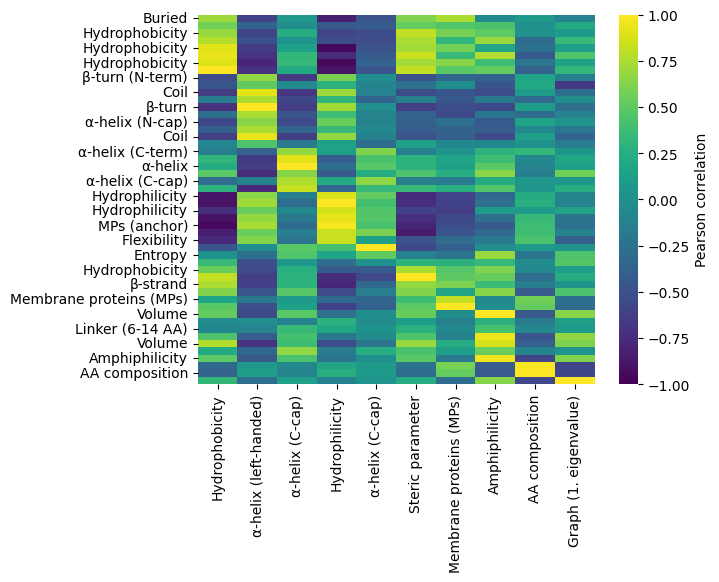
List of names can be provided for all scales (from
X) and the reference scales using thenamesandnames_refparameters:# Obtain names of clusters cluster_names = aac.name_clusters(X, labels=labels, names=names, shorten_names=False) dict_cluster = dict(zip(labels, names)) names_ref = [dict_cluster[i] for i in labels_ref] # Creat correlation DataFrane including names df_corr, _ = aac.comp_correlation(X=X, labels=labels, X_ref=X_ref, labels_ref=labels_ref, names=names, names_ref=names_ref) # Visualize correlation between scales and cluster centers sns.heatmap(df_corr, vmax=1, vmin=-1, cmap="viridis", cbar_kws=dict(label="Pearson correlation")) plt.show()