SeqOptPlot.genealogy
- SeqOptPlot.genealogy(df_pareto, ax=None, figsize=(8, 5), front_only=True, cmap='viridis')[source]
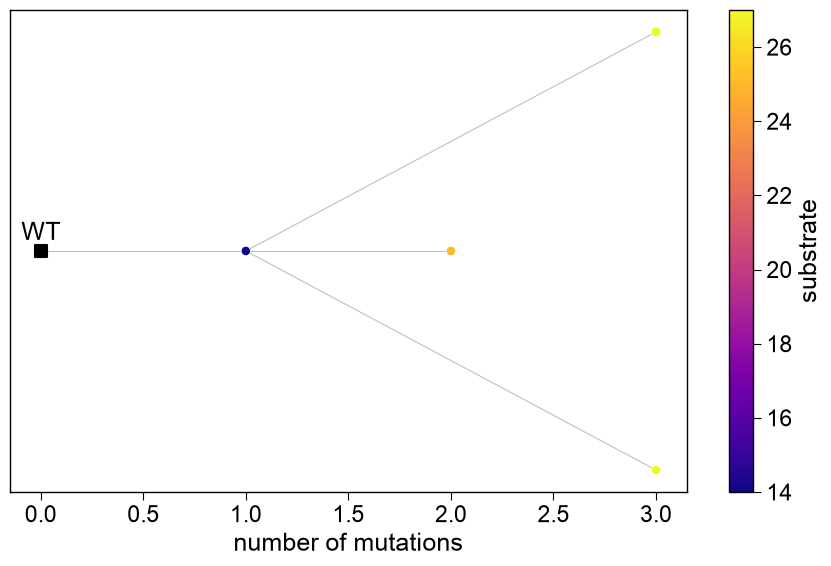
Mutational-lineage tree of the variants, rooted at the wild-type.
The directed-evolution analogue of a genealogy tree: nodes are variants placed by their number of mutations (depth), each linked to the largest lower-order variant whose mutation set it extends (or to the wild-type), and colored by the first objective. It shows how the designed variants are built up mutation by mutation from the wild-type.
- Parameters:
df_pareto (pd.DataFrame) – Output of
SeqOpt.run().ax (matplotlib.axes.Axes, optional) – Axes to draw on. A new figure is created when
None.figsize (tuple, default=(8, 5)) – Figure size when
axis None.front_only (bool, default=True) – If
True, build the lineage from the first (rank=0) front only.cmap (str, default="viridis") – Matplotlib colormap name for the objective coloring.
- Returns:
fig (matplotlib.figure.Figure) – The figure.
ax (matplotlib.axes.Axes) – The axes the lineage was drawn on.
Examples
import numpy as np, pandas as pd
import matplotlib.pyplot as plt
from sklearn.ensemble import RandomForestClassifier
import aaanalysis as aa
aa.options["verbose"] = False
df_feat = aa.load_features(name="DOM_GSEC"); df_seq = aa.load_dataset(name="DOM_GSEC", n=50)
labels = df_seq["label"].to_list(); sf = aa.SequenceFeature()
X = np.asarray(sf.feature_matrix(features=df_feat["feature"], df_parts=sf.get_df_parts(df_seq=df_seq), df_scales=aa.load_scales()), float)
model = RandomForestClassifier(n_estimators=100, random_state=0).fit(X, labels)
wt = df_seq[df_seq["label"] == 0].iloc[[0]].reset_index(drop=True)
objectives = [("substrate", "max", "delta_pred"), ("parsimony", "min", "n_mut")]
seqopt = aa.SeqOpt(mode="importance", model=model, target_class=1, random_state=42)
df_pareto = seqopt.run(df_seq=wt, df_feat=df_feat, objectives=objectives, pop_size=40, n_gen=20, n_mut_max=6, region="tmd")
aa.display_df(df_pareto, n_rows=10, show_shape=True)
DataFrame shape: (5, 8)
entry variant n_mut sequence_mut substrate parsimony rank crowding 1 Q14802 0 MQKVTLGLLVFLAGF...PGETPPLITPGSAQS 0.000000 0.000000 0 inf 2 Q14802 C49V+I55R+S58R 3 MQKVTLGLLVFLAGF...PGETPPLITPGSAQS 27.000000 3.000000 0 inf 3 Q14802 C49L+I55R+S58R 3 MQKVTLGLLVFLAGF...PGETPPLITPGSAQS 27.000000 3.000000 0 inf 4 Q14802 S58R 1 MQKVTLGLLVFLAGF...PGETPPLITPGSAQS 14.000000 1.000000 0 0.796296 5 Q14802 C49M+S58R 2 MQKVTLGLLVFLAGF...PGETPPLITPGSAQS 25.000000 2.000000 0 0.574074 aa.plot_settings() aa.SeqOptPlot().genealogy(df_pareto=df_pareto, front_only=False) plt.tight_layout(); plt.show()
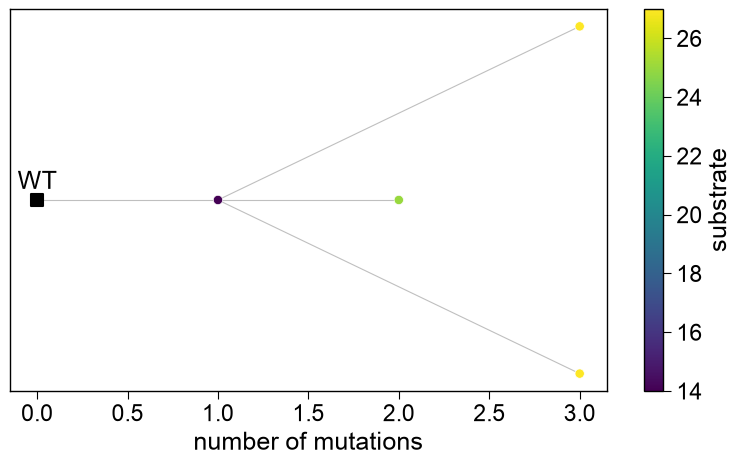
# cmap colors nodes by the first objective; figsize sets the figure size in inches
aa.plot_settings()
aa.SeqOptPlot().genealogy(df_pareto=df_pareto, cmap="plasma", figsize=(9, 6),
                          front_only=False)
plt.tight_layout(); plt.show()