ReliabilityModelPlot.ranking
- static ReliabilityModelPlot.ranking(df_rel, names=None, figsize=None, top_n=None, title=None, ax=None)[source]
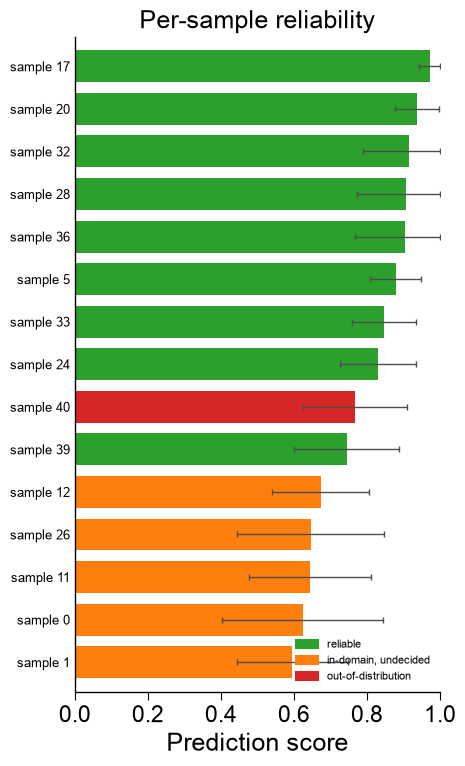
Per-sample view — each prediction’s score with its uncertainty, colored by trust status.
The core “should I trust this one?” figure: samples are ranked by score as horizontal bars with the confidence interval as an error bar, colored green (reliable), amber (in-domain but undecided), or red (out-of-distribution) — so an over-confident score on an unfamiliar input stands out as a long red bar.
- Parameters:
df_rel (pd.DataFrame) – Output of
ReliabilityModel.predict()(needsscore,ci_low/ci_high,in_domain,reliable).names (list, optional) – Per-sample labels for the y-axis; row positions are used if
None.figsize (tuple, optional) – Figure size (used only when
axisNone); scales with the sample count by default.top_n (int, optional) – Show only the
top_nhighest-scoring samples; all are shown ifNone.title (str, optional) – Axes title.
ax (matplotlib.axes.Axes, optional) – Axes to draw on; a new figure is created if
None.
- Returns:
fig (matplotlib.figure.Figure) – The created (or parent) figure.
ax (matplotlib.axes.Axes) – The axes drawn on.
Examples
ReliabilityModelPlot().ranking()is the per-sample view — should I trustthisone? Each prediction is a bar (score) with its uncertainty interval as an error bar, colored by trust status: green = reliable, amber = in-domain but undecided, red = out-of-distribution. An over-confident score on an unfamiliar input shows up as a long red bar.import aaanalysis as aa import numpy as np import matplotlib.pyplot as plt from sklearn.datasets import make_classification aa.options["verbose"] = False aa.plot_settings() X, labels = make_classification(n_samples=160, n_features=10, n_informative=6, random_state=42) X_train, labels_train = X[:120], labels[:120] # include one clearly out-of-distribution sample so the trust status is visible X_new = np.vstack([X[120:], (X_train[labels_train == 1][0] + 20.0)[None, :]]) rm = aa.ReliabilityModel(random_state=42).fit(X=X_train, labels=labels_train) df_rel = rm.predict(X=X_new) df_eval = rm.eval(X=X[120:], labels=labels[120:])
aa.ReliabilityModelPlot().ranking(df_rel=df_rel,
                                  names=[f"sample {i}" for i in range(len(df_rel))],
                                  figsize=(5, 8), top_n=15, title="Per-sample reliability",
                                  ax=None)
plt.tight_layout()
plt.show()