SeqMutPlot.epistasis
- SeqMutPlot.epistasis(df_variant, entry=None, ax=None, figsize=(7, 6), cmap='bwr')[source]
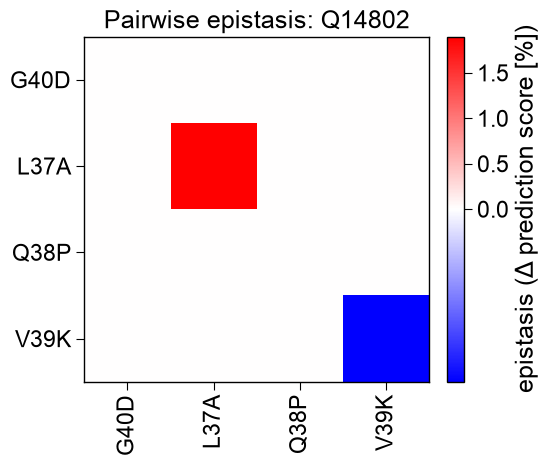
Plot the pairwise non-additivity (epistasis) of mutation pairs.
Built from a
SeqMut.combine()table holding the single mutations (n_mut == 1) and their pairwise combinations (n_mut == 2) of a chosen mutation set. Off-diagonal cell(i, j)is the epistasisΔP(i+j) - (ΔP(i) + ΔP(j))— positive (red) means the pair does better than the sum of the singles (synergy), negative (blue) worse (antagonism); the diagonal carries the single-mutation effect. Usesdelta_predwhen present, otherwiseshift_score.- Parameters:
df_variant (pd.DataFrame) – Combined-variant table from
SeqMut.combine()containing the singles and pairs.entry (str, optional) – Protein entry to plot. If
None, the first entry indf_variantis used.ax (Axes, optional) – Pre-defined Axes object to plot on. If
None, a new one is created.figsize (tuple, default=(7, 6)) – Figure dimensions (width, height) in inches (used when
axisNone).cmap (str, default='bwr') – Diverging matplotlib colormap name (0-centered).
- Returns:
fig (Figure) – Figure object containing the plot.
ax (Axes) – Axes object of the epistasis heatmap.
Notes
Returned as a
(fig, ax)pair (seeSeqMutPlotfor the shared return contract).
Examples
:meth:
SeqMutPlot.epistasismaps the pairwise non-additivity of mutations — built from a :meth:SeqMut.combinetable holding the single mutations and their pairwise combinations. Off-diagonal cells showΔP(i+j) - (ΔP(i) + ΔP(j)): red = synergy, blue = antagonism.import itertools import pandas as pd import matplotlib.pyplot as plt import aaanalysis as aa aa.options["verbose"] = False # Data, CPP features, and a fitted TreeModel that scores each sequence df_seq = aa.load_dataset(name="DOM_GSEC", n=10) labels = df_seq["label"].to_list() sf = aa.SequenceFeature() df_parts = sf.get_df_parts(df_seq=df_seq) split_kws = sf.get_split_kws() df_scales = aa.load_scales() cpp = aa.CPP(df_parts=df_parts, split_kws=split_kws, df_scales=df_scales, verbose=False) df_feat = cpp.run(labels=labels, n_filter=25) X = sf.feature_matrix(features=list(df_feat["feature"]), df_parts=df_parts, df_scales=df_scales) tm = aa.TreeModel().fit(X, labels=labels) entry = df_seq["entry"].iloc[0] ts = int(df_seq.set_index("entry").loc[entry, "tmd_start"]) muts = [(ts, "A"), (ts + 1, "P"), (ts + 2, "K"), (ts + 3, "D")] rows = [(entry, f"m{k}", p, a) for k, (p, a) in enumerate(muts)] for (i, (p1, a1)), (j, (p2, a2)) in itertools.combinations(enumerate(muts), 2): rows += [(entry, f"m{i}_m{j}", p1, a1), (entry, f"m{i}_m{j}", p2, a2)] variants = pd.DataFrame(rows, columns=["entry", "variant", "pos", "to_aa"]) df_variant = aa.SeqMut(model=tm).combine(df_seq=df_seq, variants=variants, df_feat=df_feat) aa.plot_settings() aa.SeqMutPlot().epistasis(df_variant=df_variant, entry=entry, cmap="bwr", figsize=(6, 5)) plt.tight_layout() plt.show()