SeqMutPlot.variant_impact
- SeqMutPlot.variant_impact(df_variant, entry=None, n=None, ax=None, figsize=(8, 5))[source]
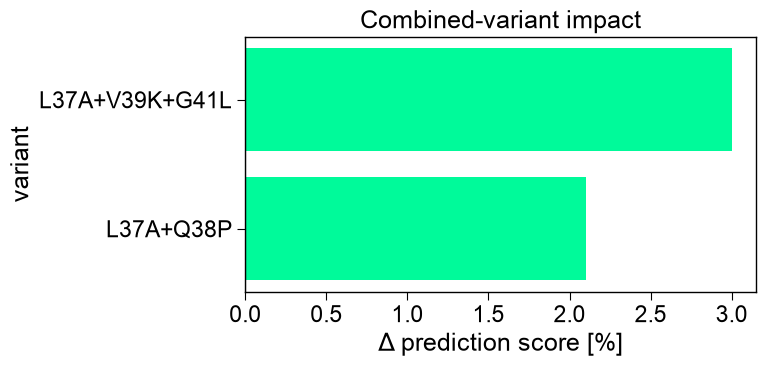
Plot a ranked bar chart of combined variants by their impact.
One horizontal bar per combined variant (from
SeqMut.combine()), its length the variant’sdelta_pred(model prediction shift) when present, otherwiseshift_score; bars are colored red/blue by sign. This is the variant-level view of stacking 2-3 mutations — complementary to the single-mutationSeqMutPlot.mutation_landscape().- Parameters:
df_variant (pd.DataFrame) – Combined-variant table produced by
SeqMut.combine().entry (str, optional) – Protein entry to plot. If
None, all variants are shown.n (int, optional) – Plot only the top
nvariants by impact. IfNone, all are shown.ax (Axes, optional) – Pre-defined Axes object to plot on. If
None, a new one is created.figsize (tuple, default=(8, 5)) – Figure dimensions (width, height) in inches (used when
axisNone).
- Returns:
fig (Figure) – Figure object containing the plot.
ax (Axes) – Axes object of the ranked-variant bar chart.
Notes
Returned as a
(fig, ax)pair (seeSeqMutPlotfor the shared return contract).
Examples
:meth:
SeqMutPlot.variant_impactranks the combined variants from :meth:SeqMut.combineas a horizontal bar chart, each bar the variant’sdelta_pred(model prediction shift) colored by sign.import itertools import pandas as pd import matplotlib.pyplot as plt import aaanalysis as aa aa.options["verbose"] = False # Data, CPP features, and a fitted TreeModel that scores each sequence df_seq = aa.load_dataset(name="DOM_GSEC", n=10) labels = df_seq["label"].to_list() sf = aa.SequenceFeature() df_parts = sf.get_df_parts(df_seq=df_seq) split_kws = sf.get_split_kws() df_scales = aa.load_scales() cpp = aa.CPP(df_parts=df_parts, split_kws=split_kws, df_scales=df_scales, verbose=False) df_feat = cpp.run(labels=labels, n_filter=25) X = sf.feature_matrix(features=list(df_feat["feature"]), df_parts=df_parts, df_scales=df_scales) tm = aa.TreeModel().fit(X, labels=labels) entry = df_seq["entry"].iloc[0] ts = int(df_seq.set_index("entry").loc[entry, "tmd_start"]) seqm = aa.SeqMut(model=tm) variants = pd.DataFrame({ "entry": [entry] * 5, "variant": ["double", "double", "triple", "triple", "triple"], "pos": [ts, ts + 1, ts, ts + 2, ts + 4], "to_aa": ["A", "P", "A", "K", "L"], }) df_variant = seqm.combine(df_seq=df_seq, variants=variants, df_feat=df_feat) aa.plot_settings() aa.SeqMutPlot().variant_impact(df_variant=df_variant, entry=entry, n=10, figsize=(8, 4)) plt.tight_layout() plt.show()