dPULearn: Learning from unbalanced data
The Deterministic Positive-Unlabeled Learning (dPULearn) class identifies reliable negatives from unlabeled data. Introduced in [Breimann25], dPULearn offers a deterministic approach to (PU) learning and enables learning from small datasets, common in life science.
You will learn
Tool:
dPULearnInput: a feature matrix
Xandlabelswith unlabeled samples (2)Output: reliable negatives identified from the unlabeled set (relabelled
0)Best used for: deriving trustworthy negatives from unlabeled data for small, unbalanced sets
Related protocol: P8: Prediction
Related API:
dPULearn,dPULearnPlot
To demonstrate how the dPULearn class works, we create load an
example dataset containing positive (1) and unlabeled (2) data samples:
import aaanalysis as aa
import pandas as pd
import numpy as np
aa.options["verbose"] = False

# Obtain unbalanced dataset
df_seq = aa.load_dataset(name="DOM_GSEC_PU")
labels = df_seq["label"].to_numpy()

# Get number of positive and unlabeled samples
n_pos = sum([x == 1 for x in labels])
n_unlabeled = sum([x == 2 for x in labels])

print(f"Number of positive samples (1): {n_pos}")
print(f"Number of unlabeled samples (2): {n_unlabeled}")
Number of positive samples (1): 63
Number of unlabeled samples (2): 631
Using the respective features, we can create a feature matrix and obtain ‘reliable’ non-substrates by dPULearn:
# Create feature matrix from benchmarking features
df_feat = aa.load_features(name="DOM_GSEC")
sf = aa.SequenceFeature()
df_parts = sf.get_df_parts(df_seq=df_seq)
X = sf.feature_matrix(features=df_feat["feature"], df_parts=df_parts)
To obtain a balanced dataset, we can use the dPUlearn.fit() method
and provide the number of positives as the number of unlabeled samples
to be identified as negatives (n_unl_to_neg parameter):
dpul = aa.dPULearn()
dpul.fit(X=X, labels=labels, n_unl_to_neg=n_pos)
df_pu = dpul.df_pu_
new_labels = dpul.labels_

# Number of updated labels containing reliable negatives (0)
print(pd.Series(new_labels).value_counts())
2    568
1     63
0     63
Name: count, dtype: int64
To visualize all identified negatives within the compressed feature
space represented by the first two Principal Components (PCs), you can
use the dPULearnPlot().pca() method:
import matplotlib.pyplot as plt

# Override labels
labels = new_labels

# Plot samples in first two principal components of feature space
dpul_plot = aa.dPULearnPlot()
aa.plot_settings(font_scale=0.8)
dpul_plot.pca(df_pu=df_pu, labels=labels)
plt.tight_layout()
plt.show()
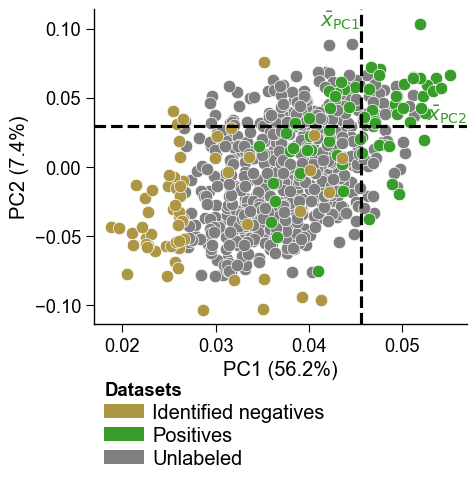
The dashed lines indicate the mean values across the positive samples
for the PC1 and PC2, based on which the samples from the unlabeled group
with the greatest distance were identified as reliable negatives by
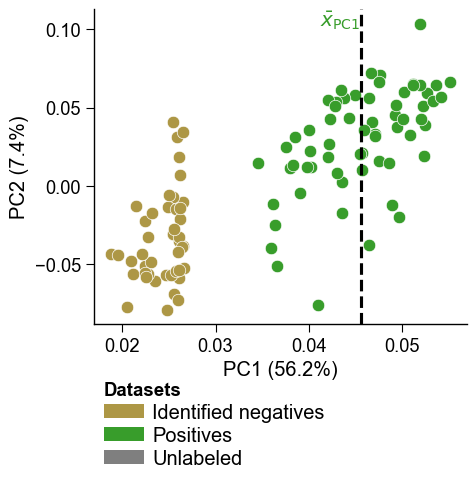
dPULearn. This becomes more clear using boolean masks and the
show_pos_mean_x and show_pos_mean_y parameters:
# Filter only positives and negatives selected based on PC1
mask1 = [x in ["PC1", None] for x in df_pu["selection_via"]]
mask2 = [x in [0, 1] for x in labels]
mask = [m1 and m2 for m1, m2 in zip(mask1, mask2)]
dpul_plot.pca(df_pu=df_pu[mask], labels=labels[mask], show_pos_mean_y=False)
plt.tight_layout()
plt.show()
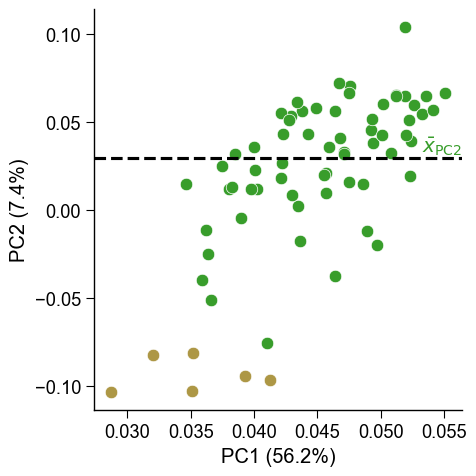
# Filter only positives and negatives selected based on PC1
mask1 = [x in ["PC2", None] for x in df_pu["selection_via"]]
mask = [m1 and m2 for m1, m2 in zip(mask1, mask2)]
dpul_plot.pca(df_pu=df_pu[mask], labels=labels[mask], show_pos_mean_x=False, legend=False)
plt.tight_layout()
plt.show()
More details on the dPULearn and dPULearn classes are given in
the PU Learning
API.
More background information on PU learning are available in our
dPULearn Usage
Principles
section.