CPPGrid: Sweeping, evaluating, and ranking configurations
This tutorial assembles the v1.2 building blocks into one honest small-N evaluation:
Feature discovery across a grid of CPP configurations with
CPPGrid.Site-localization metrics — per-protein AP (and a tolerant variant), detection@threshold, and a bootstrap CI (
comp_per_protein_ap(),comp_detection_metrics(),comp_bootstrap_ci()).Peak-preserving smoothing of a per-residue score track (
comp_smooth_scores()).A per-protein rank plot sanity check (
aa.AAPredPlot().predict_group(kind="rank_scatter")).
You will learn
Tool:
CPPGrid(plus the evaluation metrics)Input: a grid of CPP configurations over
df_parts/labelsand per-residue score tracksOutput: ranked configurations, site-localization metrics, smoothed scores, and a rank plot
Best used for: honest small-N evaluation (sweep, evaluate, and rank fairly)
Related protocol: P10: Validation
Related API:
CPPGrid,comp_per_protein_ap(),comp_detection_metrics(),comp_bootstrap_ci(),comp_smooth_scores(),predict_group()
1. Feature discovery — CPPGrid sweep
CPPGrid binds the dataset once and sweeps configurations across four
stage-grouped param dicts. A list value is a swept axis; the grid is
the Cartesian product. It returns the per-config feature tables plus a
lightweight df_params summary (object axes as a position index, plus
n_warnings / n_errors).
import numpy as np
import pandas as pd
import matplotlib.pyplot as plt
import aaanalysis as aa

aa.options["verbose"] = False
df_seq = aa.load_dataset(name="DOM_GSEC", n=20)
labels = df_seq["label"].to_list()

cppg = aa.CPPGrid(df_seq=df_seq, labels=labels, n_jobs=1, random_state=0)
list_df_feat, df_params = cppg.run(
    params_split={"split_types": "Segment"},
    params_scales=aa.load_scales(top60_n=38),
    params_cpp={"n_filter": [25, 50]},
)
df_params
| split_types | n_filter | df_scales | n_warnings | n_errors | |
|---|---|---|---|---|---|
| 0 | Segment | 25 | 0 | 0 | 0 |
| 1 | Segment | 50 | 0 | 0 | 0 |
df_params is the map from configuration to result: each row aligns
to list_df_feat[i]. Use n_warnings / n_errors to spot
configs that under-deliver (e.g. n_filter larger than the config can
generate) before trusting them downstream.
2. Site-localization metrics
These metrics score a per-residue predictor per protein. DOM_GSEC
is a domain-level dataset, so for illustration we synthesize per-residue
score tracks with known positive positions — in practice these come from
your own per-residue scorer.
per-protein AP ranks residues within each protein; the tolerant variant (
tolerance=k) credits a hit withinkresidues (positional jitter).detection metrics answer “is the site actually called?” at a fixed threshold.
bootstrap CI gives honest small-N uncertainty over the per-protein AP vector.
rng = np.random.default_rng(1)
list_scores, list_positions = [], []
for _ in range(15):
    L = int(rng.integers(50, 90))
    s = rng.random(L) * 0.7                       # background
    pos = sorted(rng.choice(L, size=int(rng.integers(1, 4)), replace=False).tolist())
    for p in pos:
        s[p] = min(1.0, s[p] + rng.uniform(0.05, 0.35))   # weak true-site signal
    list_scores.append(s)
    list_positions.append(pos)

ap = aa.comp_per_protein_ap(list_scores=list_scores, list_positions=list_positions)
ap_tol = aa.comp_per_protein_ap(list_scores=list_scores, list_positions=list_positions, tolerance=2)
det = aa.comp_detection_metrics(list_scores=list_scores, list_positions=list_positions, threshold=0.6)
ci = aa.comp_bootstrap_ci(values=ap, seed=0)

print(f"per-protein AP   : {np.mean(ap):.3f}  (95% CI {ci['ci_low']:.3f}-{ci['ci_high']:.3f})")
print(f"tolerant AP (k=2): {np.mean(ap_tol):.3f}")
print("detection@0.6   :", {k: round(float(v), 3) for k, v in det.items()})
per-protein AP   : 0.463  (95% CI 0.302-0.631)
tolerant AP (k=2): 0.587
detection@0.6   : {'recall': 0.469, 'precision': 0.093, 'f1': 0.155, 'mcc': 0.157, 'tp': 15.0, 'fp': 147.0, 'fn': 17.0, 'tn': 922.0}
3. Peak-preserving smoothing
Windowed predictions jitter by a residue or two.
comp_smooth_scores() smooths a per-residue track (triangular /
gaussian) but takes max(smoothed, raw) so true peaks are never
attenuated.
track = list_scores[0]
smoothed = aa.comp_smooth_scores(scores=track, method="triangular", window=2)
print("raw peak   :", round(float(np.max(track)), 3))
print("smoothed pk:", round(float(np.max(smoothed)), 3), "(>= raw peak by construction)")
raw peak   : 0.882
smoothed pk: 0.882 (>= raw peak by construction)
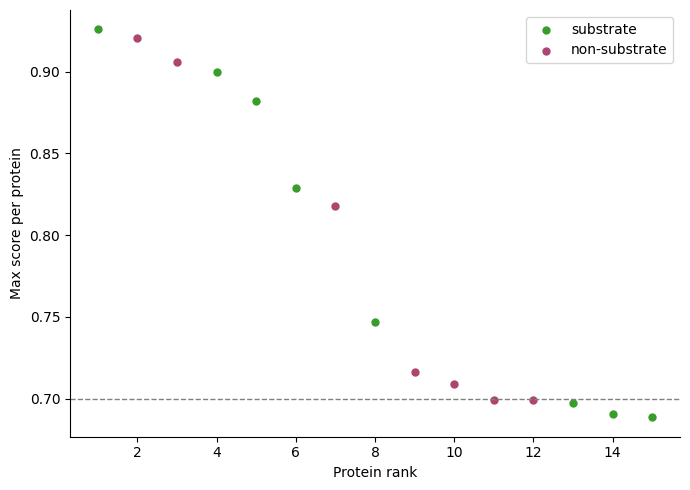
4. Per-protein rank plot
Finally, the deployed-predictor sanity check: each protein’s max score vs its rank, colored by group, with the deployment threshold drawn in.
df_rank = pd.DataFrame({
    "score": [float(s.max()) for s in list_scores],
    "group": ["substrate"] * 8 + ["non-substrate"] * 7,
})
fig, ax = aa.AAPredPlot().predict_group(df_rank, kind="rank_scatter", col_group="group",
                                        thresholds=0.7)
plt.tight_layout()
plt.show()
Takeaway. CPPGrid discovers features across a config grid; the
aa.metrics functions + comp_smooth_scores() quantify per-site
performance with honest CIs;
aa.AAPredPlot().predict_group(kind="rank_scatter") is the one-glance
deployment check. Swap the illustrative per-residue tracks for your own
scorer’s output to run this end-to-end.