AAPredPlot.eval
- static AAPredPlot.eval(df_eval, kind='eval', ax=None, figsize=None, dict_color=None, baseline=None, group='group', condition='condition', value='value', baseline_label=None, annotate=True, annotation_fmt=None, group_order=None, condition_order=None, colors=None, bar_width=0.8, xlabel=None, ylabel='Score', title=None, ylim=None, fontsize_annotations=10, xtick_rotation=0, highlight=1, vmin=None, vmax=None, cmap='viridis', cbar_label=None)[source]
Visualize model / feature-set evaluation, dispatched by
kind.Three evaluation figures share one entry point:
'eval'— grouped bar plot comparing models across metrics (hue = model), from the long-formatdf_evalofAAPred.eval()(columnsmodel,metric,principle,score,score_std). Cross-validation bars carryscore_stderror bars and held-out bars are hatched. Usesdict_color,baseline,ylabel.'comparison'— groupedconditionxgroupbenchmark barplot with per-bar value labels and an optional baseline, from a tidydf_evalwithgroup/condition/valuecolumns. Usesgroup,condition,value,baseline,baseline_label,annotate,annotation_fmt,group_order,condition_order,colors,bar_width,xlabel,ylabel,title,ylim,fontsize_annotations,xtick_rotation.'heatmap'— square annotated heatmap of a 2D score grid (df_evalis a wide DataFrame whose rows x columns are the two sweep axes and whose cells are the scores), with the best cell(s) boxed (highlightselects how many). Consolidates the recurring “grid of scores -> seaborn heatmap -> box the best configuration” block. Usesannotate,annotation_fmt,highlight,vmin,vmax,cmap,cbar_label,title.
To compare CPP parameter combinations instead, use the feature-optimization protocol
aaanalysis.pipe.find_features()and its evaluation-gridaaanalysis.pipe.plot_eval().Added in version 1.1.0.
- Parameters:
df_eval (pd.DataFrame) – Evaluation table. For
kind='eval'theAAPred.eval()output (columnsmodel,metric,principle,score,score_std); forkind='comparison'a tidy frame with thegroup/condition/valuecolumns; forkind='heatmap'a wide numeric grid whose row index and columns are the two sweep axes and whose cells are the scores.kind (str, default="eval") – Which evaluation figure to draw; one of
eval,comparison,heatmap.ax (matplotlib.axes.Axes, optional) – Axes to draw on. If
None, a new figure and axes are created.figsize (tuple, optional) – Figure size when
axisNone. IfNone, a per-kind default is used.dict_color (dict, optional) – (
kind='eval') Mappingmodel -> color(the bar hue).baseline (int or float, optional) – y-value of a dashed chance / baseline line (e.g.
0.5forkind='eval',50forkind='comparison'). IfNone, no line is drawn.group (str, default="group") – (
kind='comparison') Column whose distinct values become the colored bars (legend).condition (str, default="condition") – (
kind='comparison') Column whose distinct values become the x-axis clusters.value (str, default="value") – (
kind='comparison') Column with the numeric bar heights.baseline_label (str, optional) – (
kind='comparison') Legend label for the baseline;Nonegenerates"chance (<baseline>)";""draws the line without a legend entry.annotate (bool, default=True) – (
kind='comparison') IfTrue, write each bar’s value above it. (kind='heatmap') IfTrue, write each cell’s value inside it.annotation_fmt (str, optional) – (
kind='comparison') Format string for the value labels; auto-chosen whenNone. (kind='heatmap') Cell-value format; whenNone,".2f"for[0, 1]-scaled scores and".0f"otherwise.group_order (list of str, optional) – (
kind='comparison') Order of the groups (bars within a cluster).condition_order (list of str, optional) – (
kind='comparison') Order of the conditions (x-axis clusters).colors (list of str or dict, optional) – (
kind='comparison') Bar colors aligned togroup_orderor agroup -> colordict.bar_width (int or float, default=0.8) – (
kind='comparison') Total width of each cluster (split across the groups); in (0, 1].xlabel (str, optional) – (
kind='comparison') x-axis label.ylabel (str, default="Score") – y-axis label.
title (str, optional) – (
kind='comparison'/'heatmap') Axes title.ylim (tuple, optional) – (
kind='comparison') y-axis limits(bottom, top).fontsize_annotations (int or float, default=10) – (
kind='comparison') Font size of the per-bar value labels.xtick_rotation (int or float, default=0) – (
kind='comparison') Rotation (degrees) of the cluster tick labels.highlight (int, str, tuple, or list, default=1) –
(
kind='heatmap') Which cell(s) to box with a bold frame: a positive intNboxes theNbest (highest-value) cells (1= the single best),"max"/"min"box the single best / worst cell, an explicit(row, col)(or list of them) boxes those cells, andNoneboxes nothing.Added in version 1.1.0.
vmin (int or float, optional) –
(
kind='heatmap') Lower bound of the color scale; auto-scaled whenNone.Added in version 1.1.0.
vmax (int or float, optional) –
(
kind='heatmap') Upper bound of the color scale; auto-scaled whenNone.Added in version 1.1.0.
cmap (str, default="viridis") –
(
kind='heatmap') Colormap for the heatmap cells.Added in version 1.1.0.
cbar_label (str, optional) –
(
kind='heatmap') Label of the colorbar; defaults to"Score".Added in version 1.1.0.
- Returns:
fig (matplotlib.figure.Figure) – The figure.
ax (matplotlib.axes.Axes) – The axes with the requested evaluation plot.
See also
AAPred.eval()for the evaluation table this visualizes.aaanalysis.pipe.find_features()andaaanalysis.pipe.plot_eval()for comparing CPP parameter combinations (a heatmap over the parameter grid).
Examples
AAPredPlot().eval(df_eval, kind=...)visualizes model / feature-set evaluation.kind='eval'compares models across metrics from :meth:AAPred.eval;kind='comparison'draws a grouped benchmark barplot from a tidy frame;kind='heatmap'draws an annotated score grid with the optimal cell boxed (see [Breimann25]):``eval`` = model / feature-set comparison (not per-protein prediction). Pick the
kind:'eval'— grouped bars, hue = model (compare methods across metrics).'comparison'— grouped benchmark bars (method × condition) with a chance line.'heatmap'— annotated score grid (two sweep axes) with the optimal cell boxed.
For comparing CPP parameter ranges (not models), use the optimization protocol
aap.find_features+aap.plot_evalinstead.import pandas as pd import matplotlib.pyplot as plt import aaanalysis as aa aa.options["verbose"] = False # Disable verbosity aa.plot_settings() # DOM_GSEC example dataset + its feature set (see [Breimann25]_) df_seq = aa.load_dataset(name="DOM_GSEC") labels = df_seq["label"].to_list() df_feat = aa.load_features(name="DOM_GSEC").head(20) sf = aa.SequenceFeature() X = sf.feature_matrix(features=df_feat, df_parts=sf.get_df_parts(df_seq=df_seq)) # Evaluate two models across metrics aapred = aa.AAPred(models=["svm", "rf"], random_state=42) df_eval = aapred.eval(X, labels) aapred_plot = aa.AAPredPlot() aa.display_df(df_eval, n_rows=10, show_shape=True)
/Users/stephanbreimann/Programming/1Packages/aaanalysis/.venv/lib/python3.13/site-packages/sklearn/svm/_base.py:239: FutureWarning: The probability parameter was deprecated in 1.9 and will be removed in version 1.11. Use CalibratedClassifierCV(SVC(), ensemble=False) instead of SVC(probability=True)
  warnings.warn(
/Users/stephanbreimann/Programming/1Packages/aaanalysis/.venv/lib/python3.13/site-packages/sklearn/svm/_base.py:239: FutureWarning: The probability parameter was deprecated in 1.9 and will be removed in version 1.11. Use CalibratedClassifierCV(SVC(), ensemble=False) instead of SVC(probability=True)
  warnings.warn(
/Users/stephanbreimann/Programming/1Packages/aaanalysis/.venv/lib/python3.13/site-packages/sklearn/svm/_base.py:239: FutureWarning: The probability parameter was deprecated in 1.9 and will be removed in version 1.11. Use CalibratedClassifierCV(SVC(), ensemble=False) instead of SVC(probability=True)
  warnings.warn(
/Users/stephanbreimann/Programming/1Packages/aaanalysis/.venv/lib/python3.13/site-packages/sklearn/svm/_base.py:239: FutureWarning: The probability parameter was deprecated in 1.9 and will be removed in version 1.11. Use CalibratedClassifierCV(SVC(), ensemble=False) instead of SVC(probability=True)
  warnings.warn(
/Users/stephanbreimann/Programming/1Packages/aaanalysis/.venv/lib/python3.13/site-packages/sklearn/svm/_base.py:239: FutureWarning: The probability parameter was deprecated in 1.9 and will be removed in version 1.11. Use CalibratedClassifierCV(SVC(), ensemble=False) instead of SVC(probability=True)
  warnings.warn(
/Users/stephanbreimann/Programming/1Packages/aaanalysis/.venv/lib/python3.13/site-packages/sklearn/svm/_base.py:239: FutureWarning: The probability parameter was deprecated in 1.9 and will be removed in version 1.11. Use CalibratedClassifierCV(SVC(), ensemble=False) instead of SVC(probability=True)
  warnings.warn(
/Users/stephanbreimann/Programming/1Packages/aaanalysis/.venv/lib/python3.13/site-packages/sklearn/svm/_base.py:239: FutureWarning: The probability parameter was deprecated in 1.9 and will be removed in version 1.11. Use CalibratedClassifierCV(SVC(), ensemble=False) instead of SVC(probability=True)
  warnings.warn(
/Users/stephanbreimann/Programming/1Packages/aaanalysis/.venv/lib/python3.13/site-packages/sklearn/svm/_base.py:239: FutureWarning: The probability parameter was deprecated in 1.9 and will be removed in version 1.11. Use CalibratedClassifierCV(SVC(), ensemble=False) instead of SVC(probability=True)
  warnings.warn(
/Users/stephanbreimann/Programming/1Packages/aaanalysis/.venv/lib/python3.13/site-packages/sklearn/svm/_base.py:239: FutureWarning: The probability parameter was deprecated in 1.9 and will be removed in version 1.11. Use CalibratedClassifierCV(SVC(), ensemble=False) instead of SVC(probability=True)
  warnings.warn(
/Users/stephanbreimann/Programming/1Packages/aaanalysis/.venv/lib/python3.13/site-packages/sklearn/svm/_base.py:239: FutureWarning: The probability parameter was deprecated in 1.9 and will be removed in version 1.11. Use CalibratedClassifierCV(SVC(), ensemble=False) instead of SVC(probability=True)
  warnings.warn(
/Users/stephanbreimann/Programming/1Packages/aaanalysis/.venv/lib/python3.13/site-packages/sklearn/svm/_base.py:239: FutureWarning: The probability parameter was deprecated in 1.9 and will be removed in version 1.11. Use CalibratedClassifierCV(SVC(), ensemble=False) instead of SVC(probability=True)
  warnings.warn(
/Users/stephanbreimann/Programming/1Packages/aaanalysis/.venv/lib/python3.13/site-packages/sklearn/svm/_base.py:239: FutureWarning: The probability parameter was deprecated in 1.9 and will be removed in version 1.11. Use CalibratedClassifierCV(SVC(), ensemble=False) instead of SVC(probability=True)
  warnings.warn(
/Users/stephanbreimann/Programming/1Packages/aaanalysis/.venv/lib/python3.13/site-packages/sklearn/svm/_base.py:239: FutureWarning: The probability parameter was deprecated in 1.9 and will be removed in version 1.11. Use CalibratedClassifierCV(SVC(), ensemble=False) instead of SVC(probability=True)
  warnings.warn(
/Users/stephanbreimann/Programming/1Packages/aaanalysis/.venv/lib/python3.13/site-packages/sklearn/svm/_base.py:239: FutureWarning: The probability parameter was deprecated in 1.9 and will be removed in version 1.11. Use CalibratedClassifierCV(SVC(), ensemble=False) instead of SVC(probability=True)
  warnings.warn(
/Users/stephanbreimann/Programming/1Packages/aaanalysis/.venv/lib/python3.13/site-packages/sklearn/svm/_base.py:239: FutureWarning: The probability parameter was deprecated in 1.9 and will be removed in version 1.11. Use CalibratedClassifierCV(SVC(), ensemble=False) instead of SVC(probability=True)
  warnings.warn(
/Users/stephanbreimann/Programming/1Packages/aaanalysis/.venv/lib/python3.13/site-packages/sklearn/svm/_base.py:239: FutureWarning: The probability parameter was deprecated in 1.9 and will be removed in version 1.11. Use CalibratedClassifierCV(SVC(), ensemble=False) instead of SVC(probability=True)
  warnings.warn(
/Users/stephanbreimann/Programming/1Packages/aaanalysis/.venv/lib/python3.13/site-packages/sklearn/svm/_base.py:239: FutureWarning: The probability parameter was deprecated in 1.9 and will be removed in version 1.11. Use CalibratedClassifierCV(SVC(), ensemble=False) instead of SVC(probability=True)
  warnings.warn(
/Users/stephanbreimann/Programming/1Packages/aaanalysis/.venv/lib/python3.13/site-packages/sklearn/svm/_base.py:239: FutureWarning: The probability parameter was deprecated in 1.9 and will be removed in version 1.11. Use CalibratedClassifierCV(SVC(), ensemble=False) instead of SVC(probability=True)
  warnings.warn(
/Users/stephanbreimann/Programming/1Packages/aaanalysis/.venv/lib/python3.13/site-packages/sklearn/svm/_base.py:239: FutureWarning: The probability parameter was deprecated in 1.9 and will be removed in version 1.11. Use CalibratedClassifierCV(SVC(), ensemble=False) instead of SVC(probability=True)
  warnings.warn(
/Users/stephanbreimann/Programming/1Packages/aaanalysis/.venv/lib/python3.13/site-packages/sklearn/svm/_base.py:239: FutureWarning: The probability parameter was deprecated in 1.9 and will be removed in version 1.11. Use CalibratedClassifierCV(SVC(), ensemble=False) instead of SVC(probability=True)
  warnings.warn(
DataFrame shape: (8, 5)
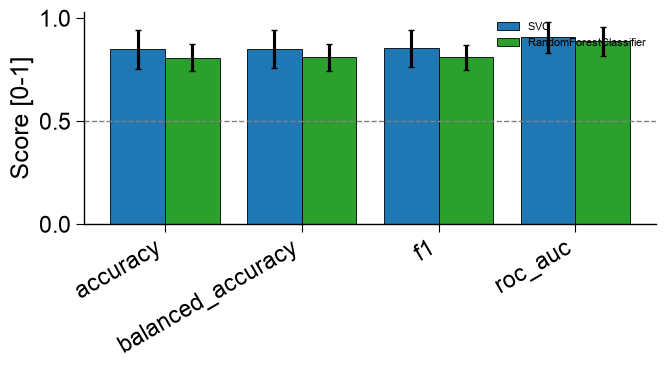
model metric principle score score_std 1 SVC accuracy cv 0.848923 0.092943 2 SVC balanced_accuracy cv 0.849359 0.092783 3 SVC f1 cv 0.854063 0.089412 4 SVC roc_auc cv 0.907199 0.073961 5 RandomForestClassifier accuracy cv 0.809231 0.064659 6 RandomForestClassifier balanced_accuracy cv 0.810256 0.065416 7 RandomForestClassifier f1 cv 0.810256 0.059252 8 RandomForestClassifier roc_auc cv 0.887278 0.071059 ``kind=’eval’`` (default) draws a grouped bar plot comparing the models across metrics (hue = model), with
score_stderror bars.baselineadds a chance line,dict_colorsets the per-model hue, andylabel/figsizestyle the axes:model_names = df_eval["model"].unique() aapred_plot.eval(df_eval, kind="eval", baseline=0.5, ylabel="Score [0-1]", figsize=(7, 4), dict_color={model_names[0]: "tab:blue", model_names[1]: "tab:green"}) plt.tight_layout() plt.show()
``kind=’comparison’`` draws a benchmark barplot from a tidy frame: each
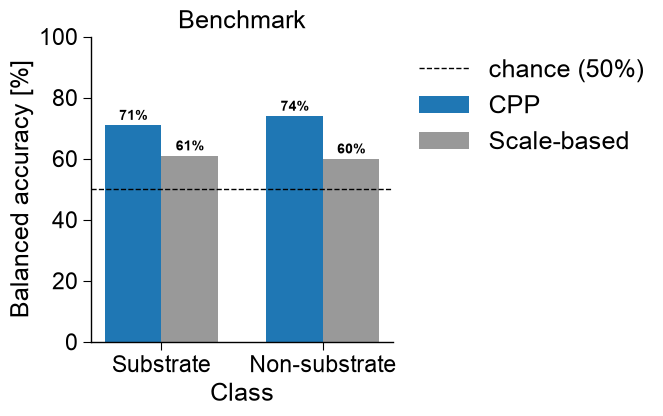
conditionis an x-axis cluster and eachgroupa colored bar. Here a scale-based baseline is compared against CPP features on two classes:df_bench = pd.DataFrame({ "group": ["Scale-based", "Scale-based", "CPP", "CPP"], "condition": ["Substrate", "Non-substrate", "Substrate", "Non-substrate"], "value": [61.0, 60.0, 71.0, 74.0], }) aa.display_df(df_bench, n_rows=10, show_shape=True)
DataFrame shape: (4, 3)
group condition value 1 Scale-based Substrate 61.000000 2 Scale-based Non-substrate 60.000000 3 CPP Substrate 71.000000 4 CPP Non-substrate 74.000000 aapred_plot.eval( df_bench, kind="comparison", group="group", condition="condition", value="value", baseline=50, baseline_label="chance (50%)", annotate=True, annotation_fmt="{:.0f}%", group_order=["CPP", "Scale-based"], condition_order=["Substrate", "Non-substrate"], colors={"CPP": "tab:blue", "Scale-based": "0.6"}, bar_width=0.7, figsize=(7, 4.5), xlabel="Class", ylabel="Balanced accuracy [%]", title="Benchmark", ylim=(0, 100), fontsize_annotations=10, xtick_rotation=0) plt.tight_layout() plt.show()
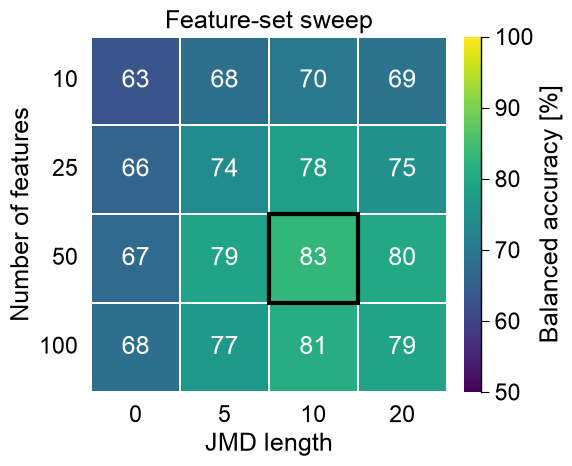
``kind=’heatmap’`` turns any 2D score grid (
df_evalis a wide frame whose rows and columns are the two sweep axes) into a square annotated heatmap and boxes the best cell(s) — collapsing the recurring “grid of scores → seaborn heatmap → mark the best configuration” block into one call.highlightpicks how many top cells to frame (a positive int for the top-N,"max"/"min"for the single best/worst, an explicit(row, col)or list of them, orNone),vmin/vmax/cmapset the color scale, andcbar_labellabels the colorbar:# Feature-set sweep: balanced accuracy [%] for #features (rows) x JMD length (cols). # Any 2D score grid works; here a small illustrative grid (see the gamma-secretase use case). df_grid = pd.DataFrame( [[63, 68, 70, 69], [66, 74, 78, 75], [67, 79, 83, 80], [68, 77, 81, 79]], index=pd.Index([10, 25, 50, 100], name="Number of features"), columns=pd.Index([0, 5, 10, 20], name="JMD length")) aapred_plot.eval(df_grid, kind="heatmap", highlight="max", vmin=50, vmax=100, cmap="viridis", cbar_label="Balanced accuracy [%]", annotate=True, annotation_fmt=".0f", title="Feature-set sweep") plt.tight_layout() plt.show()