comp_kld
- comp_kld(X, labels, label_test=1, label_ref=0)[source]
Compute the Kullback-Leibler Divergence (KLD) [0, ∞) for assessing the similarity between two groups.
The KLD is calculated for each feature in
X, comparing the distributions between two subgroups specified bylabel_testandlabel_refin labels. Generally, the KLD measures how one probability distribution diverges from a second, expected probability distribution. Higher KLD values indicate more divergence. The observed upper limit lies around 200 indicating complete divergence of two non-overlapping distributions.Added in version 1.0.0.
- Parameters:
X (array-like, shape (n_samples, n_features)) – Feature matrix. Rows typically correspond to proteins and columns to features.
labels (array-like, shape (n_samples,)) – Labels for each sample in
X. Should contain only integer label values and at least 2 per class.label_test (int, default=1,) – Class label of test group in
labels.label_ref (int, default=0,) – Class label of reference group in
labels.
- Returns:
kld – Array of Kullback-Leibler Divergence values for each feature in
X. Each value represents the divergence of the test group distribution from the reference group distribution for that feature.- Return type:
array-like, shape (n_features,)
Notes
For valid KLD calculations, the input matrix X must meet certain conditions:
Ensure adequate variability of features in
Xto avoid computational problems like singular covariance matrices in Gaussian Kernel Density Estimation (KDE).Avoid rows in
Xlying in a lower-dimensional subspace; consider dimensionality reduction if necessary.
See also
scipy.stats.gaussian_kde()function representing a kernel-density estimate using Gaussian kernels. It is used for estimating the probability density function of a random variable (i.e., feature inX), which is a crucial step in the computation of Kullback-Leibler Divergence (KLD).scipy.stats.entropy()function for computing the Shannon entropy. In the context of KLD, it is used to measure the divergence between two probability distributions, typically derived from kernel-density estimates of different data groups.
Examples
You can compare the similarity of two distributions (here two normal distributions for a test and a reference group) utilizing the Kullback-Leibler Divergence (KLD). Higher KLD values indicate more divergence. Provide only feature matrix
Xand its respective grouplabelsto thecomp_kldfunction:import numpy as np import seaborn as sns import matplotlib.pyplot as plt import aaanalysis as aa # Generate random data for two groups group_test = np.random.normal(-2, 0.5, 1000) # Mean = -2, Std = 0.5, 1000 samples group_ref = np.random.normal(2, 0.5, 1000) # Mean = 2, Std = 0.5, 1000 samples # Combine data into a single dataset and reshape it X = np.hstack([group_test, group_ref]).reshape(-1, 1) # Reshape to 2D array labels = np.array([1]*1000 + [0]*1000) kld_score = round(aa.comp_kld(X, labels)[0], 3) # Plot aa.plot_settings() sns.histplot(group_test, color="tab:red", kde=True, label='Test group', alpha=0.5) sns.histplot(group_ref, color="tab:gray", kde=True, label='Reference group', alpha=0.5) plt.title(f"KLD = {kld_score} (All test samples are smaller)") aa.plot_legend(dict_color=dict(Test="tab:red", Ref="tab:gray"), ncol=1, x=0.85, y=1) sns.despine() plt.show()

The greater the overlap between both distributions, the closer the
kld_scoreis to 0:group_test = np.random.normal(-0.5, 0.5, 1000) group_ref = np.random.normal(0.5, 0.5, 1000) X = np.hstack([group_test, group_ref]).reshape(-1, 1) # Reshape to 2D array labels = np.array([1]*1000 + [0]*1000) kld_score = round(aa.comp_kld(X, labels)[0], 3) # Plot aa.plot_settings() sns.histplot(group_test, color="tab:red", kde=True, label='Test group', alpha=0.5) sns.histplot(group_ref, color="tab:gray", kde=True, label='Reference group', alpha=0.5) plt.title(f"KLD = {kld_score} (Most test samples are smaller)") sns.despine() plt.show()

A
kld_scoreof 0 indicates a perfect overlap:group_test = np.random.normal(0, 0.5, 1000) group_ref = np.random.normal(0, 0.5, 1000) X = np.hstack([group_test, group_ref]).reshape(-1, 1) # Reshape to 2D array labels = np.array([1]*1000 + [0]*1000) kld_score = round(aa.comp_kld(X, labels)[0], 3) # Plot aa.plot_settings() sns.histplot(group_test, color="tab:red", kde=True, label='Test group', alpha=0.5) sns.histplot(group_ref, color="tab:gray", kde=True, label='Reference group', alpha=0.5) plt.title(f"KLD = {kld_score} (Distributions are almost identical)") sns.despine() plt.show()

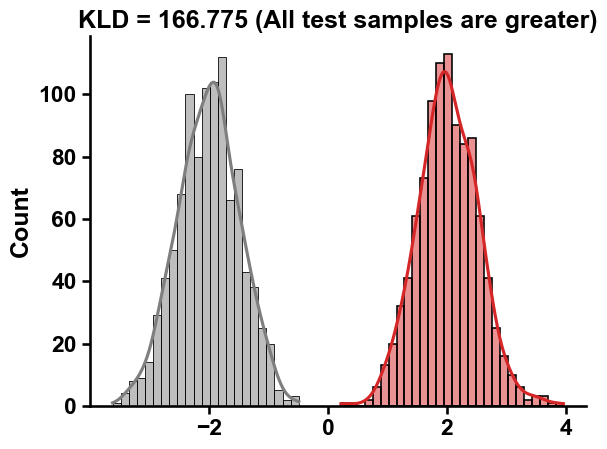
The
kld_scorereaches its maximum when all values from the test group (with the higher integer value) exceed those of the reference group, and similarly, when all values from the reference group surpass those of the test group:group_test = np.random.normal(2, 0.5, 1000) group_ref = np.random.normal(-2, 0.5, 1000) X = np.hstack([group_test, group_ref]).reshape(-1, 1) # Reshape to 2D array labels = np.array([1]*1000 + [0]*1000) kld_score = round(aa.comp_kld(X, labels)[0], 3) # Plot aa.plot_settings() sns.histplot(group_test, color="tab:red", kde=True, label='Test group', alpha=0.5) sns.histplot(group_ref, color="tab:gray", kde=True, label='Reference group', alpha=0.5) plt.title(f"KLD = {kld_score} (All test samples are greater)") sns.despine() plt.show()
As for the other metrics,
label_test(default1) andlabel_ref(default0) name the two groups inlabels; set them to match your encoding when the test group is not labelled1.# Further parameters: name the test/reference classes in `labels` explicitly via # label_test (default 1) and label_ref (default 0). group_test = np.random.normal(-2, 0.5, 1000) group_ref = np.random.normal(2, 0.5, 1000) X = np.hstack([group_test, group_ref]).reshape(-1, 1) labels = np.array([1]*1000 + [0]*1000) kld_scores = aa.comp_kld(X=X, labels=labels, label_test=1, label_ref=0) print("KLD =", round(float(kld_scores[0]), 3))
KLD = 174.829