plot_get_cdict
- plot_get_cdict(name='DICT_COLOR')[source]
Get color dictionaries specified for AAanalysis.
Returns one of two curated name-to-color mappings: the general plot palette (
DICT_COLOR) or the scale-category palette (DICT_CAT). Use the returned dict to pass consistent colors to matplotlib calls or to build custom palettes alongsideplot_get_clist()andplot_get_cmap().Added in version 0.1.2.
- Parameters:
name ({'DICT_COLOR', 'DICT_CAT'}, default='DICT_COLOR') –
The name of the AAanalysis color dictionary.
DICT_COLOR: Dictionary with default colors for plots.DICT_CAT: Dictionary with default colors for scale categories.
- Returns:
AAanalysis color dictionary.
- Return type:
dict_color
See also
Examples
We provide two default
AAanalysisdefault color dictionaries, which can be accessed viaaa.plot_get_cdict(). First, colors for plot elements such as SHAP plots can be retrieved byname='DICT_COLOR':import matplotlib.pyplot as plt import seaborn as sns import aaanalysis as aa dict_color = aa.plot_get_cdict(name="DICT_COLOR") data = {"Plot Elements": list(dict_color.keys()), 'Values': [1] * len(dict_color) } aa.plot_settings(weight_bold=False) ax = sns.barplot(data=data, x="Values", y="Plot Elements", palette=dict_color, hue="Plot Elements") ax.xaxis.set_visible(False) sns.despine() plt.tight_layout() plt.show()

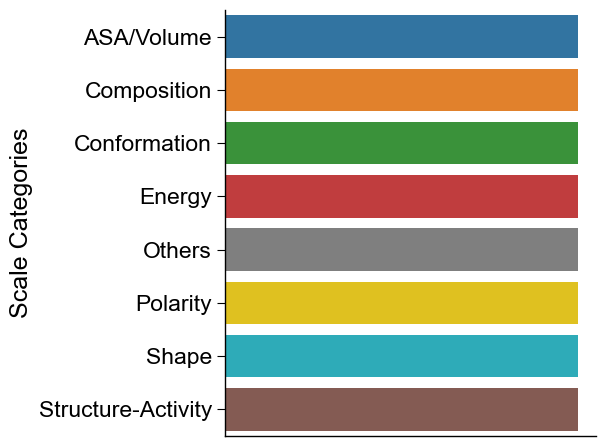
The other dictionary comprises the default colors for the scale categories from AAontology, retrieved by
name='DICT_CAT':dict_color = aa.plot_get_cdict(name="DICT_CAT") data = {"Scale Categories": list(dict_color.keys()), 'Values': [1] * len(dict_color) } aa.plot_settings(weight_bold=False) ax = sns.barplot(data=data, x="Values", y="Scale Categories", palette=dict_color, hue="Scale Categories") ax.xaxis.set_visible(False) sns.despine() plt.tight_layout() plt.show()