CPPPlot.update_seq_size
- CPPPlot.update_seq_size(ax, fig=None, max_x_dist=0.1, fontsize_tmd_jmd=None, weight_tmd_jmd='normal', tmd_color='mediumspringgreen', jmd_color='blue', tmd_seq_color='black', jmd_seq_color='white')[source]
Update the font size of the sequence characters to prevent overlap.
This method adjusts the font size of TMD-JMD sequence characters based on their provided sequences to ensure that the labels are clearly legible and do not overlap in the plot.
Added in version 0.1.0.
- Parameters:
ax (Axes) – Comparative Physicochemical Profiling (CPP) plot axes object.
fig (Figure, optional) – CPP plot figure object. If given,
fontsize_tmd_jmdwill be automatically adjusted.max_x_dist (float, default=0.1) – Maximum allowed horizontal distance between sequence characters during font size optimization. A greater value reduces potential overlaps of sequence characters.
fontsize_tmd_jmd (int or float, optional) – Font size (>=0) for the part labels: ‘JMD-N’, ‘TMD’, ‘JMD-C’. If
None, optimized automatically.weight_tmd_jmd ({'normal', 'bold'}, default='normal') – Font weight for the part labels: ‘JMD-N’, ‘TMD’, ‘JMD-C’.
tmd_color (str, default='mediumspringgreen') – Color for target middle domain (TMD).
jmd_color (str, default='blue') – Color for juxta middle domains (JMDs).
tmd_seq_color (str, default='black') – Color for TMD sequence.
jmd_seq_color (str, default='white') – Color for JMD sequences.
- Returns:
fig (Figure) – Figure object containing the plot.
ax (Axes) – CPP plot axes object.
Notes
Returned as a
(fig, ax)pair (seeCPPPlotfor the shared return contract).Use
CPPPlot.update_seq_size()AFTERmatplotlib.pyplot.tight_layout().
See also
CPPPlot.profile()andCPPPlot.heatmap()methods, which also use thetmd_seq,jmd_n_seq, andjmd_c_seqparameters.CPPPlot.update_seq_size()should be called after further plot modifications that alter the size of figure or x-axis.
Examples
To demonstrate the
CPPPlot().update_seq_size()method, we first load the exampleDOM_GSECdataset and its respective features (see [Breimann25]):import matplotlib.pyplot as plt import aaanalysis as aa aa.options["verbose"] = False df_seq = aa.load_dataset(name="DOM_GSEC") sf = aa.SequenceFeature() df_parts = sf.get_df_parts(df_seq=df_seq) df_feat = aa.load_features(name="DOM_GSEC") df_feat = df_feat.sort_values(by="feat_importance", ascending=False).reset_index(drop=True) aa.display_df(df_feat, show_shape=True, n_rows=7)
DataFrame shape: (150, 15)
feature category subcategory scale_name scale_description abs_auc abs_mean_dif mean_dif std_test std_ref p_val_mann_whitney p_val_fdr_bh positions feat_importance feat_importance_std 1 TMD_C_JMD_C-Seg...,11)-LIFS790102 Conformation β-strand β-strand Conformational ...n-Sander, 1979) 0.189000 0.125674 0.125674 0.183876 0.218813 0.000001 0.000039 28,29 4.729200 4.776785 2 TMD_C_JMD_C-Seg...2,3)-CHOP780212 Conformation β-sheet (C-term) β-turn (1st residue) Frequency of th...-Fasman, 1978b) 0.199000 0.065983 -0.065983 0.087814 0.105835 0.000000 0.000016 27,28,29,30,31,32,33 4.106000 5.236574 3 TMD_C_JMD_C-Seg...3,4)-HUTJ700102 Energy Entropy Entropy Absolute entrop...Hutchens, 1970) 0.229000 0.098224 0.098224 0.106865 0.124608 0.000000 0.000001 31,32,33,34,35 3.111200 3.109955 4 TMD_C_JMD_C-Seg...2,3)-AURR980110 Conformation α-helix α-helix (middle) Normalized posi...ora-Rose, 1998) 0.211000 0.077355 0.077355 0.102965 0.107453 0.000000 0.000005 27,28,29,30,31,32,33 3.048800 3.623912 5 TMD_C_JMD_C-Pat...4,8)-JANJ790102 Energy Free energy (unfolding) Transfer free e...(TFE) to inside Transfer free e...y (Janin, 1979) 0.187000 0.144354 -0.144354 0.181777 0.233103 0.000001 0.000049 33,37 2.833600 3.640617 6 TMD_C_JMD_C-Pat...4,8)-KANM800103 Conformation α-helix α-helix Average relativ...sa-Tsong, 1980) 0.176000 0.087846 0.087846 0.140464 0.157561 0.000004 0.000113 24,28 2.704000 4.076269 7 TMD_C_JMD_C-Pat...,10)-LEVM760105 Shape Side chain length Side chain length Radius of gyrat... (Levitt, 1976) 0.149000 0.073526 0.073526 0.133612 0.157088 0.000090 0.000714 31,34,38 2.050800 2.338278 We can now use the
CPPPlot().profile()method to create CPP profile showing the feature importance at single-residue resolution. We first retrieve fromdf_seqthe sequences parts of a selected sample and provide them as parameters (jmd_n_seq,tmd_seq,jmd_c_seq) together withdf_feat:# Get sequence parts of first sample seq_kws = sf.get_seq_kws(df_seq=df_seq, df_parts=df_parts, sample=0) jmd_n_seq, tmd_seq, jmd_c_seq = seq_kws["jmd_n_seq"], seq_kws["tmd_seq"], seq_kws["jmd_c_seq"] print(seq_kws) # Plot CPP profile for first sample cpp_plot = aa.CPPPlot() aa.plot_settings() cpp_plot.profile(df_feat=df_feat, **seq_kws) plt.show()
{'jmd_n_seq': 'FAEDVGSNKG', 'tmd_seq': 'AIIGLMVGGVVIATVIVITLVML', 'jmd_c_seq': 'KKKQYTSIHH'}

Adding a new element, such as a legend, to the plot could cause overlapping of sequence characters:
# Plot CPP profile for first sample with color-coded scale categories
cpp_plot = aa.CPPPlot()
aa.plot_settings()
cpp_plot.profile(df_feat=df_feat, **seq_kws, add_legend_cat=True)

# Add legend right next to plot
list_cats = list(sorted(set(df_feat["category"])))
dict_color = aa.plot_get_cdict(name="DICT_CAT")
dict_color = {cat: dict_color[cat] for cat in list_cats}
fs = aa.plot_gcfs()
aa.plot_legend(dict_color=dict_color, y=1, x=0.9, n_cols=1, fontsize=fs-3)
plt.tight_layout()
plt.show()

Avoid sequence character overlap
The overlap of the sequence characters can be resolved by decreasing the sequence fontsize (
seq_size) of theCPPPlot().profile()manually or by simply using theCPPPlot().udpdate_seq_size()method with theaxobject of the respective plot:# Adjust size of sequence characters fig, ax = cpp_plot.profile(df_feat=df_feat, **seq_kws, add_legend_cat=True) aa.plot_legend(dict_color=dict_color, y=1, x=0.9, n_cols=1, fontsize=fs-3) plt.tight_layout() cpp_plot.update_seq_size(ax=ax) # Should be called AFTER plt.tight_layout() plt.show()

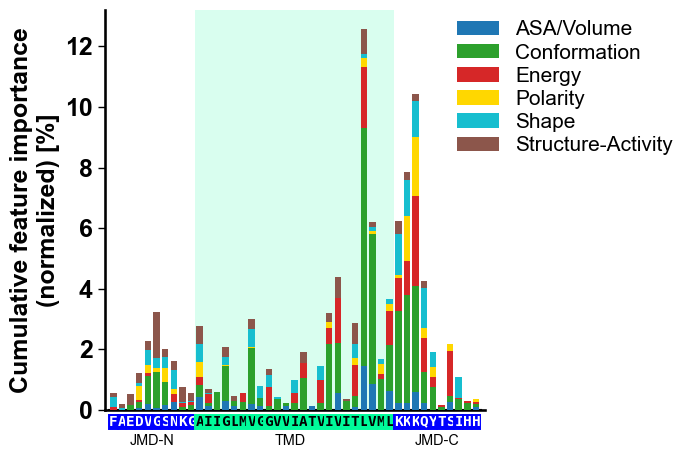
To automatically adjust the fontsize of the part labels (‘JMD-N’, ‘TMD’, and ‘JMD-C’), provide the
figparameter:# Adjust size of sequence characters and part labels fig, ax = cpp_plot.profile(df_feat=df_feat, **seq_kws, add_legend_cat=True) aa.plot_legend(dict_color=dict_color, y=1, x=0.9, n_cols=1, fontsize=fs-3) plt.tight_layout() cpp_plot.update_seq_size(ax=ax, fig=fig) plt.show()

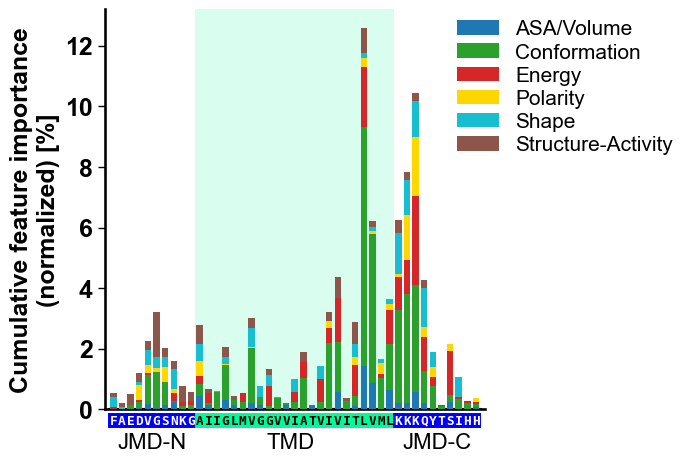
You can adjust the sequence fontsize optimization process using the
max_x_dist(default=0.1) parameter, where smaller values will yield a bigger fontsize:fig, ax = cpp_plot.profile(df_feat=df_feat, **seq_kws, add_legend_cat=True) aa.plot_legend(dict_color=dict_color, y=1, x=0.9, n_cols=1, fontsize=fs-3) plt.tight_layout() cpp_plot.update_seq_size(ax=ax, fig=fig, max_x_dist=0.0) plt.show()
The fontsize and weight of the part labels (‘JMD-N’, ‘TMD’, and ‘JMD-C’) can be manually adjusted using the
fontsize_tmd_jmdandweight_tmd_jmd(default=‘bold’) parameters:fig, ax = cpp_plot.profile(df_feat=df_feat, **seq_kws, add_legend_cat=True) aa.plot_legend(dict_color=dict_color, y=1, x=0.9, n_cols=1, fontsize=fs-3) plt.tight_layout() cpp_plot.update_seq_size(ax=ax, fig=fig, fontsize_tmd_jmd=16, weight_tmd_jmd="normal") plt.show()
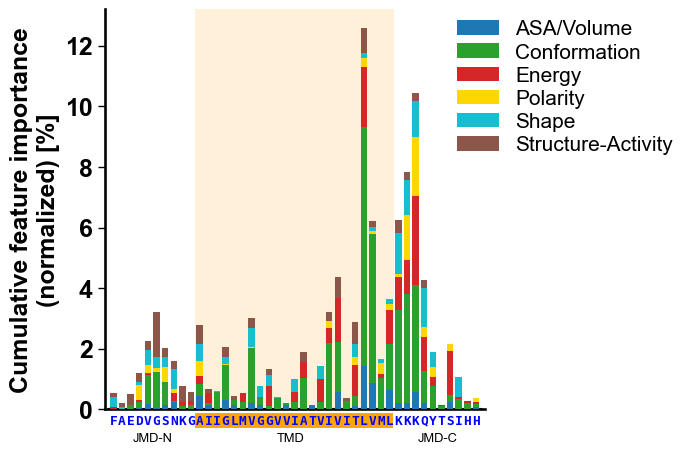
You can change the color of the sequence parts by the
tmd_color(default=‘mediumspringgreen’) andjmd_color(default=‘blue’) parameters;tmd_colorin theCPPPlot().profile()method should match. Adjust the sequence color using thetmd_seq_color(default=‘black’) andjmd_seq_color(default=‘white’) parameters:fig, ax = cpp_plot.profile(df_feat=df_feat, **seq_kws, add_legend_cat=True, tmd_color="orange") aa.plot_legend(dict_color=dict_color, y=1, x=0.9, n_cols=1, fontsize=fs-3) plt.tight_layout() cpp_plot.update_seq_size(ax=ax, fig=fig, tmd_color="orange", jmd_color="white", tmd_seq_color="blue", jmd_seq_color="blue") plt.show()