P7: Select & reduce features
Keep the strong, drop the redundant. A CPP signature (from P1: CPP
signature) is discriminative, but it is rarely parsimonious. It can
hold hundreds of position-resolved physicochemical features, and
neighbouring positions or correlated scales inside one AAontology
category often say nearly the same thing. A raw numeric matrix (say,
protein language model embedding dimensions) is just as redundant. This
protocol shows how to reduce any labelled matrix (X, y) to a
compact, non-redundant subset that still separates the test
group (label=1) from the reference group (label=0). This
reduction step sits between the two task classes of the pipeline: it
takes the output of determinant discovery (the full signature from
P1) and hands a compact input to prediction (the classifier in P8).
We stay at the domain level here (dataset prefix DOM_): the
unit of comparison is the transmembrane-domain (TMD) part set,
and the test group is γ-secretase substrates contrasted against
non-substrate references.
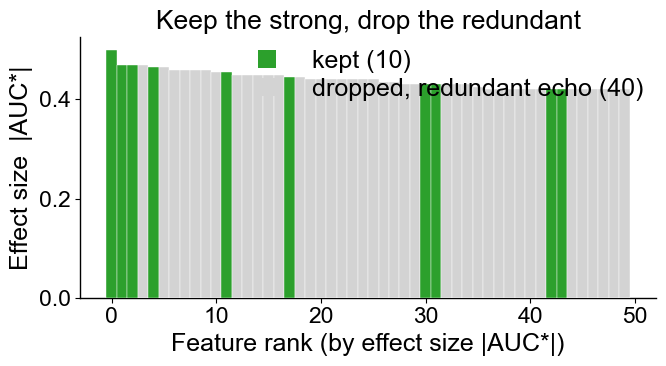
Keep the strong, drop the redundant. Rank features by effect size
(the magnitude of the adjusted AUC, |AUC*|, a feature’s
group-separating strength), then walk that ranking and discard any
feature that merely echoes an already-kept, stronger one. Effect size
first, then de-correlate: that order is the contract. What survives
is the non-redundant core of the signature. The recipe at a glance
figure below makes this concrete: features ranked by effect size,
survivors highlighted, redundant echoes greyed out. Two further figures
then make the reduction auditable: one draws the criterion itself
(what was kept, and why), the other puts the signature before and
after reduction side by side.
When to use it. Use this protocol once you already have a feature set or a numeric matrix and want a compact, non-redundant subset that still separates the two groups. The biological question is: which features actually carry the group-separating signal (which TMD/JMD physicochemical patterns, or which embedding dimensions) once near-duplicates have been removed?
Three mechanisms coexist in AAanalysis, and we walk all three:
Model-free (univariate): rank each feature on its own effect size and prune correlated echoes. No classifier is fitted, the ranking is the basis. This is the CPP-style recipe that runs on any
(X, y).Model-based: let a fitted tree report which features it actually relied on, and keep those (
select_features()).CPP-internal:
run()already prunes redundancy while building the signature; you can tune and inspect that funnel directly.
When not to use it. Skip reduction while you are still discovering determinants and want the full signature for interpretation: that is P1’s job, and pruning hides correlated members of a physicochemical family you may want to read. Skip it too if your matrix is already small and uncorrelated, or if your downstream model does its own regularisation and you are not after a human-readable shortlist.
Input. The input is any (X, y): an
(n_samples, n_features) numeric matrix X plus binary integer
labels y (1 = test, 0 = reference). Two sources appear
below:
A CPP feature matrix produced upstream by P1: CPP signature.
feature_matrix()turns the signaturedf_feat+df_partsintoX, keeping the per-feature metadata (feature,category,abs_auc, …).An arbitrary user matrix with no CPP metadata (e.g. protein language model embedding dimensions). Here you track surviving column indices instead of feature names.
Labels come from the label column of df_seq
(df_seq["label"].to_list()), never from len(df_seq):
load_dataset(..., n=N) returns 2N rows, N per class.
import aaanalysis as aa
import numpy as np
import pandas as pd
import matplotlib.pyplot as plt

aa.options["verbose"] = False
aa.options["random_state"] = 42
Run.
A. Build the CPP feature matrix (upstream, from P1). Split the
sequences into parts, run CPP on the parts to obtain the signature,
then materialise the numeric feature matrix X (see the CPP tutorial
for the function details). We keep the fixtures small (n=10, giving
20 sequences) and n_filter=50 so every cell stays well under the
nbmake budget.
df_seq = aa.load_dataset(name="DOM_GSEC", n=10)   # 20 sequences: 10 substrates / 10 non-substrates
labels = df_seq["label"].to_list()

sf = aa.SequenceFeature()
df_parts = sf.get_df_parts(df_seq=df_seq)
cpp = aa.CPP(df_parts=df_parts)
df_feat = cpp.run(labels=labels, n_filter=50, n_jobs=1)

X = sf.feature_matrix(features=df_feat["feature"], df_parts=df_parts)
aa.display_df(df=df_feat[["feature", "abs_auc"]], n_rows=10, show_shape=True)
X.shape
DataFrame shape: (50, 2)
| feature | abs_auc | |
|---|---|---|
| 1 | JMD_N_TMD_N-Seg...,10)-ZIMJ680101 | 0.500000 |
| 2 | JMD_N_TMD_N-Pat...,12)-PALJ810110 | 0.470000 |
| 3 | TMD-Pattern(N,1...,11)-PALJ810110 | 0.470000 |
| 4 | TMD_C_JMD_C-Pat...,12)-TANS770105 | 0.470000 |
| 5 | TMD_C_JMD_C-Pat...,15)-AURR980102 | 0.465000 |
| 6 | TMD_C_JMD_C-Pat...,14)-AURR980102 | 0.465000 |
| 7 | TMD-Pattern(C,4,8)-CHOP780201 | 0.460000 |
| 8 | TMD_C_JMD_C-Pat...4,8)-CHOP780201 | 0.460000 |
| 9 | TMD-Pattern(C,4,8)-RACS820114 | 0.460000 |
| 10 | TMD_C_JMD_C-Pat...4,8)-RACS820114 | 0.460000 |
(20, 50)
The model-free CPP-style recipe (four steps). This is the recipe described above, made concrete:
Effect size per feature:
comp_auc_adjusted()returns the adjusted AUC (AUC*) for every column, in[-0.5, 0.5]. The sign is direction (which group is higher); the strength is the magnitude|AUC*|.Sort columns by ``|AUC*|`` descending: strongest separators first.
:meth:`~aaanalysis.NumericalFeature.filter_correlation` on the SORTED matrix. This is order-dependent: it walks the columns left-to-right and keeps the first of each correlated pair, discarding any later column whose Pearson correlation with an already-kept one exceeds
max_cor. Feeding it effect-sorted columns is therefore mandatory, this is the sort-first contract. On unsorted input it would keep arbitrary representatives.Take the top-n of the survivors.
A few things to notice. The mask returned by filter_correlation can
have fewer True entries than the requested n: pruning
correlated echoes removes columns, so the kept set is capped at whatever
survives, never padded back up. And X here is already
redundancy-reduced: run() in section A applied its own
per-AAontology-category scale-correlation filter (default
max_cor=0.5, max_overlap=0.5, check_cat=True). This
model-free pass is layered on top of it, yet it still prunes a lot
(even at the looser max_cor=0.7) because filter_correlation
computes Pearson correlation on the actual feature-matrix columns
across all categories, so it catches cross-category echoes that
CPP’s per-category filter never compares. The two filters see different
redundancy, which is why a permissive second pass keeps shrinking an
already-0.5-filtered set.
# 1) effect size, 2) effect-sorted column order
auc = aa.comp_auc_adjusted(X=X, labels=labels, label_test=1, label_ref=0, n_jobs=1)
order = np.argsort(np.abs(auc), kind="stable")[::-1]  # stable: deterministic tie order

# 3) correlation filter on the EFFECT-SORTED matrix (sort-first contract)
nf = aa.NumericalFeature()
mask = nf.filter_correlation(X=X[:, order], max_cor=0.7)
kept = order[mask]          # original column indices, still in effect order

# 4) top-n of the non-redundant survivors
top_n = kept[:20]

# funnel: kept can be < n_features once correlated echoes are pruned (never padded up)
funnel = {"n_features": X.shape[1], "n_after_filter": int(mask.sum()), "n_top": len(top_n)}
aa.display_df(df=df_feat.iloc[top_n][["feature", "category", "abs_auc"]], n_rows=10, show_shape=True)
funnel
DataFrame shape: (10, 3)
| feature | category | abs_auc | |
|---|---|---|---|
| 1 | JMD_N_TMD_N-Seg...,10)-ZIMJ680101 | Polarity | 0.500000 |
| 4 | TMD_C_JMD_C-Pat...,12)-TANS770105 | Conformation | 0.470000 |
| 3 | TMD-Pattern(N,1...,11)-PALJ810110 | Conformation | 0.470000 |
| 6 | TMD_C_JMD_C-Pat...,14)-AURR980102 | Conformation | 0.465000 |
| 11 | TMD-Pattern(N,3...,15)-NAKH920108 | Composition | 0.455000 |
| 19 | TMD_C_JMD_C-Seg...5,7)-WOLS870102 | Others | 0.445000 |
| 33 | TMD_C_JMD_C-Pat...,10)-GUYH850105 | ASA/Volume | 0.430000 |
| 32 | JMD_N_TMD_N-Pat...,10)-NAKH920102 | Composition | 0.430000 |
| 44 | TMD_C_JMD_C-Pat...,13)-QIAN880122 | Conformation | 0.420000 |
| 43 | TMD_C_JMD_C-Pat...,12)-VASM830101 | Conformation | 0.420000 |
{'n_features': 50, 'n_after_filter': 10, 'n_top': 10}
The recipe at a glance. Here is the whole idea in one picture.
Features are ranked left-to-right by effect size |AUC*|; the
kept survivors are highlighted and the dropped redundant echoes
greyed out. Notice how the de-correlation step does not simply take a
prefix of the ranking: it keeps a strong feature, then skips every
weaker feature correlated with it, so the survivors are spread across
the ranking rather than bunched at the front.
import seaborn as sns

# Effect-sorted bars: survivors highlighted, redundant echoes greyed out
abs_auc_sorted = np.abs(auc)[order]
n_keep = int(mask.sum())
n_drop = X.shape[1] - n_keep
c_keep, c_drop = "tab:green", "lightgray"
colors = [c_keep if m else c_drop for m in mask]

aa.plot_settings(weight_bold=False, short_ticks=True)
fig, ax = plt.subplots(figsize=(7, 4))
ax.bar(range(len(abs_auc_sorted)), abs_auc_sorted, color=colors,
       width=1.0, edgecolor="white", linewidth=0.3, zorder=3)
ax.set_xlabel("Feature rank (by effect size |AUC*|)")
ax.set_ylabel("Effect size  |AUC*|")
ax.set_title("Keep the strong, drop the redundant", size=aa.plot_gcfs() + 1)
sns.despine()

# tidy legend carrying the kept / dropped counts
dict_color = {f"kept ({n_keep})": c_keep,
              f"dropped, redundant echo ({n_drop})": c_drop}
aa.plot_legend(ax=ax, dict_color=dict_color, n_cols=1,
               loc="upper right", marker="s", marker_size=13)

plt.tight_layout()
plt.show()
The criterion, made explicit. The figure above shows that features
were dropped; this one shows why, because reduction is only defensible
if the rule behind it is auditable. The rule filter_correlation
applies is a single line:
Walking the effect-sorted columns from strongest to weakest, keep a feature if its Pearson correlation with every already-kept (that is, stronger) feature stays at or below
max_cor; otherwise drop it as an echo of that stronger feature.
Nothing else enters the decision: not the AAontology category, not the
position in the sequence, not a fitted model. The cell below unrolls
that same greedy walk to record, per feature, the number the decision
turned on (max_cor_to_kept, its highest correlation with any
stronger kept feature) and the verdict it implies. The final check
confirms the unrolled walk reproduces filter_correlation’s mask
exactly, so the recorded reasons are the real ones. Note also where the
top-n cut sits: it is applied after the walk, so with 10 survivors
the requested top_n=20 never binds.
# The same greedy rule filter_correlation applies, unrolled to record WHY each
# feature was kept or dropped. R holds |Pearson r| between the sorted columns.
R = np.abs(np.corrcoef(X[:, order], rowvar=False))
max_cor = 0.7
idx_kept, rows = [], []
for rank, col in enumerate(order, start=1):
    r_to_kept = R[rank - 1, idx_kept] if idx_kept else np.array([0.0])
    r_max = float(r_to_kept.max())
    rank_echo = idx_kept[int(r_to_kept.argmax())] + 1 if idx_kept else 0
    is_kept = r_max <= max_cor
    if is_kept:
        idx_kept.append(rank - 1)
    rows.append({"rank": rank,
                 "feature": df_feat["feature"].iloc[col],
                 "category": df_feat["category"].iloc[col],
                 "abs_auc": round(float(np.abs(auc)[col]), 3),
                 "max_cor_to_kept": round(r_max, 2),
                 "decision": "kept" if is_kept else f"dropped: echo of rank {rank_echo}"})
df_criterion = pd.DataFrame(rows)

aa.display_df(df=df_criterion, n_rows=10, show_shape=True)
# the unrolled walk must reproduce the library mask, otherwise the reasons lie
{"agrees_with_filter_correlation": bool((np.isin(np.arange(len(order)), idx_kept) == mask).all())}
DataFrame shape: (50, 6)
| rank | feature | category | abs_auc | max_cor_to_kept | decision | |
|---|---|---|---|---|---|---|
| 1 | 1 | JMD_N_TMD_N-Seg...,10)-ZIMJ680101 | Polarity | 0.500000 | 0.000000 | kept |
| 2 | 2 | TMD_C_JMD_C-Pat...,12)-TANS770105 | Conformation | 0.470000 | 0.680000 | kept |
| 3 | 3 | TMD-Pattern(N,1...,11)-PALJ810110 | Conformation | 0.470000 | 0.600000 | kept |
| 4 | 4 | JMD_N_TMD_N-Pat...,12)-PALJ810110 | Conformation | 0.470000 | 1.000000 | dropped: echo of rank 3 |
| 5 | 5 | TMD_C_JMD_C-Pat...,14)-AURR980102 | Conformation | 0.465000 | 0.590000 | kept |
| 6 | 6 | TMD_C_JMD_C-Pat...,15)-AURR980102 | Conformation | 0.465000 | 1.000000 | dropped: echo of rank 5 |
| 7 | 7 | TMD_C_JMD_C-Pat...4,8)-RACS820114 | Shape | 0.460000 | 0.920000 | dropped: echo of rank 2 |
| 8 | 8 | TMD-Pattern(C,4,8)-RACS820114 | Shape | 0.460000 | 0.920000 | dropped: echo of rank 2 |
| 9 | 9 | TMD_C_JMD_C-Pat...4,8)-CHOP780201 | Conformation | 0.460000 | 0.910000 | dropped: echo of rank 2 |
| 10 | 10 | TMD-Pattern(C,4,8)-CHOP780201 | Conformation | 0.460000 | 0.910000 | dropped: echo of rank 2 |
{'agrees_with_filter_correlation': True}
# The criterion drawn: one dot per feature, placed at its rank and at the
# number the decision turned on. Everything above the max_cor line is dropped.
is_kept = np.isin(np.arange(len(order)), idx_kept)
r_max_all = df_criterion["max_cor_to_kept"].to_numpy()
ranks = np.arange(1, len(order) + 1)

aa.plot_settings(weight_bold=False, short_ticks=True)
fig, ax = plt.subplots(figsize=(7, 4.2))
ax.scatter(ranks[is_kept], r_max_all[is_kept], color=c_keep, s=45,
           edgecolor="white", linewidth=0.7, zorder=3)
ax.scatter(ranks[~is_kept], r_max_all[~is_kept], color=c_drop, s=45,
           edgecolor="white", linewidth=0.7, zorder=3)
ax.axhline(max_cor, color="tab:red", ls="--", lw=1.3, zorder=2)
ax.text(len(ranks) * 0.55, max_cor + 0.05, f"max_cor = {max_cor} (the cut)",
        color="tab:red", ha="left", va="bottom", size=aa.plot_gcfs() - 2)
ax.set_xlabel("Feature rank (by effect size |AUC*|)")
ax.set_ylabel("Max |r| to a kept feature")
ax.set_ylim(-0.05, 1.12)
ax.set_title("What was kept, and why", size=aa.plot_gcfs() + 1)
sns.despine()
aa.plot_legend(ax=ax, dict_color={f"kept: |r| <= {max_cor} ({int(is_kept.sum())})": c_keep,
                                  f"dropped: |r| > {max_cor} ({int((~is_kept).sum())})": c_drop},
               n_cols=1, loc="lower right", marker="o", marker_size=9,
               fontsize=aa.plot_gcfs() - 2)

plt.tight_layout()
plt.show()

Read the dots by height, not by rank: a feature sits high because a stronger feature already says the same thing. The survivors are the dots that stayed below the line, and the first feature has nothing above it to echo, so it sits at 0 and is always kept.
The signature before and after reduction. The criterion tells you
what left; this figure tells you what that cost. Both panels are the
same view of the signature, the positional profile of df_feat
(how much of the feature set covers each residue position along the
JMD-N / TMD / JMD-C axis), drawn once for the full run() output
and once for the survivors. normalize=True turns each panel into the
percentage of its own feature set sitting at each position, and both
panels are drawn on one shared y-axis, so a 50-feature profile and a
10-feature one can be compared by shape rather than by count. The
question a reduction has to answer is whether the regions carrying the
signal are still represented after the cut.
# The signature before and after: the same positional profile, both from
# CPPPlot.profile, drawn for the full signature and for the survivors.
df_feat_reduced = df_feat.iloc[top_n]
cpp_plot = aa.CPPPlot()
list_df_feat = [df_feat, df_feat_reduced]

# Both profiles are normalized, so one shared y-axis makes them comparable.
# Pre-pass on a throwaway figure to find the tallest bar (bars only, not the
# full-width TMD highlight), then draw for real.
fig_tmp, axes_tmp = plt.subplots(2, 1)
for ax, df_ in zip(axes_tmp, list_df_feat):
    cpp_plot.profile(df_feat=df_, col_imp=None, normalize=True, ax=ax)
y_max = max(p.get_height() for ax in axes_tmp for p in ax.patches if p.get_width() < 2) * 1.1
plt.close(fig_tmp)

aa.plot_settings(weight_bold=False, short_ticks=True)
fig, axes = plt.subplots(2, 1, figsize=(9, 7))
titles = [f"Before reduction: {len(df_feat)} CPP features",
          f"After reduction: {len(df_feat_reduced)} non-redundant survivors"]
for ax, df_, title in zip(axes, list_df_feat, titles):
    cpp_plot.profile(df_feat=df_, col_imp=None, normalize=True, ylim=(0, y_max), ax=ax)
    ax.set_title(title, size=aa.plot_gcfs())
    ax.set_ylabel("Relative feature\ncoverage [%]", size=aa.plot_gcfs() - 2)

plt.tight_layout(h_pad=2.0)
plt.show()

Notice the two things the panels say together. The footprint survives: the positions the full signature leans on, the C-terminal half of the TMD and the TMD/JMD-C boundary, are still the tallest bars after reduction, so what the filter removed was duplication, not a region. And the profile thins: fewer positions carry the signature, and the stacks of correlated features that piled onto the same residues flatten, because each family now contributes a single representative instead of a cloud. That is the whole trade in one picture, a fifth of the features for the same positional story, at the cost of the within-family detail a reader of P1 may want to keep.
B. The same recipe on an arbitrary numeric matrix (embedding
analog). For a raw (X, y) with no CPP metadata (e.g. protein
language model embedding dimensions), the identical four steps apply.
(The matrix here is a deliberately synthetic stand-in for a real
PLM-embedding matrix, with signal injected into known columns purely to
make the kept-vs-dropped behaviour reproducible. It is not a
recommended workflow input; in practice X would be real embeddings
or a CPP feature matrix.) The only difference: you track surviving
column indices rather than feature names. Below, columns 0 and 4
carry the separating signal, while columns 1 and 5 are noisier
echoes of them: each echo shares its partner’s noise (so they stay
highly correlated) but carries only half the class shift (so its
|AUC*| is clearly weaker). Within each correlated pair the
sort-first filter keeps the stronger original (0 and 4, ranked first
by effect size) and drops the weaker echo (1 and 5).
rng = np.random.default_rng(42)
Xe = rng.normal(size=(40, 12))
ye = np.array([0, 1] * 20)

# inject a separating signal into two dimensions (columns 0 and 4) ...
Xe[ye == 1, 0] += 1.5
Xe[ye == 1, 4] += 1.0
# ... then add echoes: columns 1 and 5 reuse each partner's noise (-> highly
# correlated) but carry only HALF the class shift (-> clearly weaker effect).
Xe[:, 1] = Xe[:, 0].copy(); Xe[ye == 1, 1] -= 0.75
Xe[:, 5] = Xe[:, 4].copy(); Xe[ye == 1, 5] -= 0.5

auc_e = aa.comp_auc_adjusted(X=Xe, labels=ye, n_jobs=1)
order_e = np.argsort(np.abs(auc_e), kind="stable")[::-1]
mask_e = nf.filter_correlation(X=Xe[:, order_e], max_cor=0.7)
kept_dims = order_e[mask_e]

# stronger originals 0 and 4 survive; their weaker echoes 1 and 5 are dropped
{"order": order_e.tolist(), "kept_dims": kept_dims.tolist()}
{'order': [0, 4, 1, 11, 6, 5, 2, 7, 10, 3, 8, 9],
 'kept_dims': [0, 4, 11, 6, 2, 7, 10, 3, 8, 9]}
C. Alternative: model-based :meth:`~aaanalysis.TreeModel.select_features`. When you
have (or fit) a tree model, you can select by learned importance
instead of univariate effect size. fit() computes
Monte-Carlo feature importances; select_features then row-filters
df_feat by one strategy + one param knob (see the TreeModel
tutorial for the function details):
'top_k': keep theparam(int) features with the highestfeat_importance.'threshold': keep features withfeat_importance >= param(float).'frequency': keep features chosen in at least aparamfraction of rounds; requiresfit(use_rfe=True)(otherwise every round keeps all features, a no-opRuntimeWarning).
A selection that retains no features raises ValueError rather
than returning an empty frame.
# Every public parameter by name; the values here are the defaults, except for
# verbose / random_state, which are pinned so the protocol is reproducible.
tm = aa.TreeModel(list_model_classes=None, list_model_kwargs=None,
                  is_preselected=None, verbose=False, random_state=42)
# fit() computes feat_importance regardless of use_rfe; top_k/threshold use it
# directly. Only the frequency strategy needs use_rfe=True.
tm = tm.fit(X=X, labels=labels, n_rounds=5, use_rfe=False, n_cv=5,
            n_feat_min=25, n_feat_max=50, metric="accuracy", step=None)
df_feat_imp = tm.add_feat_importance(df_feat=df_feat, drop=False, sort=False)
df_sel = tm.select_features(df_feat=df_feat_imp, strategy="top_k", param=15)

aa.display_df(df=df_sel[["feature", "feat_importance"]], n_rows=10, show_shape=True)
df_sel.shape
DataFrame shape: (15, 2)
| feature | feat_importance | |
|---|---|---|
| 1 | JMD_N_TMD_N-Seg...,10)-ZIMJ680101 | 6.658000 |
| 2 | JMD_N_TMD_N-Pat...,12)-PALJ810110 | 3.799000 |
| 3 | TMD-Pattern(N,1...,11)-PALJ810110 | 4.025000 |
| 4 | TMD_C_JMD_C-Pat...,12)-TANS770105 | 3.316000 |
| 5 | TMD_C_JMD_C-Pat...,15)-AURR980102 | 2.700000 |
| 6 | TMD_C_JMD_C-Pat...,14)-AURR980102 | 3.287000 |
| 7 | TMD-Pattern(N,3...,15)-NAKH920108 | 2.436000 |
| 8 | TMD_C_JMD_C-Pat...,15)-MUNV940102 | 3.140000 |
| 9 | TMD_C_JMD_C-Seg...5,7)-WOLS870102 | 2.344000 |
| 10 | TMD_C_JMD_C-Pat...,10)-ROSM880101 | 2.201000 |
(15, 15)
D. Alternative: CPP’s internal redundancy filter, inspecting the
funnel. run() already performs redundancy reduction as part of
the algorithm: it ranks candidates by effect size (abs_auc), then
prunes by position overlap (max_overlap) and correlation
(max_cor), optionally per AAontology category
(check_cat=True). Because this greedy filter removes redundant
features, n_final can be fewer than the requested n_filter:
the requested number is a ceiling, not a guarantee. The cell below
inspects this funnel: on this tiny fixture the tight max_cor=0.3
/ max_overlap=0.3 still admit enough features to fill the ceiling,
so it makes the stages visible rather than a shortfall. (The genuine
sub-ceiling shortfall is shown in the model-free path above, where 50
features drop to far fewer.)
The funnel is exposed via return_stats=True (also stashed in
df_feat.attrs["last_filter_stats"] and on
cpp.last_filter_stats_): n_candidates, n_after_prefilter,
n_after_redundancy, n_final. A genuine shortfall is surfaced as
a RuntimeWarning. To retain more features, raise max_cor /
max_overlap (admitting more redundancy).
# CPP.run at full stretch: every public parameter by name. Only max_cor /
# max_overlap deviate from the defaults, to tighten the redundancy filter.
df_feat2, stats = cpp.run(
    labels=labels, label_test=1, label_ref=0,
    n_filter=50, n_pre_filter=None, pct_pre_filter=5, max_std_test=0.2,
    max_cor=0.3, max_overlap=0.3, check_cat=True, parametric=False,
    start=1, tmd_len=20, jmd_n_len=10, jmd_c_len=10,
    n_jobs=1, vectorized=True, n_batches=None, n_sample_batches=None,
    return_stats=True, redundancy="legacy",
)
# n_final (== len(df_feat2)) can be < the requested n_filter
{**stats, "len_df_feat2": len(df_feat2)}
{'n_candidates': 580140,
 'n_after_prefilter': 29007,
 'n_after_redundancy': 50,
 'n_final': 50,
 'len_df_feat2': 50}
Output. Each path yields a non-redundant subset, in a shape that matches its basis:
Path |
Returns |
Shape note |
|---|---|---|
Model-free recipe |
array of kept column
indices ( |
|
|
row-filtered
|
|
CPP redundancy filter |
|
`` n_final <= n_filter`` |
The model-free recipe is the only one that runs on a bare (X, y)
with no feature metadata.
How to interpret.
Mechanism |
Basis |
Input it needs |
Knob |
When to use |
Gotcha |
|---|---|---|---|---|---|
|
un ivariate, m odel-free |
any `` (X, y)``; columns must be effect -sorted |
`` max_cor`` |
a bare matrix, or you trust effect size over a model |
s
ort-first
contract;
can
return
|
`` TreeModel .select_f eatures`` |
learned model i mportance |
fitted
|
|
you have / want a c lassifier in the loop |
|
CPP r edundancy filter |
`` abs_auc`` + overlap + co rrelation |
sequences -> `` CPP.run`` |
|
building the signature itself |
``
n_final``
can be
|
Biological reading. The survivors are the non-redundant determinants of the test group: the distinct physicochemical patterns (or embedding directions) that separate substrates from non-substrates, with each correlated family represented by its single strongest member rather than a cloud of near-duplicates.
Key takeaways
Effect size first, de-correlate second. Rank by
|AUC*|, then prune correlated echoes: the sort-first contract is what makesfilter_correlationkeep the strong representative of each family instead of an arbitrary one.The criterion is one line, so state it. A feature is kept unless its correlation with an already-kept, stronger feature exceeds
max_cor; themax_cor_to_keptcolumn and the criterion figure above record that number per feature, which is what makes a reduction auditable rather than a black box.Fewer is the rule, not a bug. Both
filter_correlationandrun()can return fewer features than you asked for; the requestednis a ceiling. Raisemax_cor/max_overlapto keep more.Three filters see different redundancy. Univariate correlation, learned tree importance, and CPP’s per-category filter prune on different signals, so layering them shrinks an already-reduced set further.
Common mistakes.
Calling ``filter_correlation`` on unsorted columns: it keeps the first of each correlated pair, so unsorted input keeps arbitrary (possibly weak) representatives. Always sort by
|AUC*|first (the sort-first contract).Expecting exactly ``n`` features back: both
filter_correlationandrun()can return fewer than requested once redundant features are pruned. Raisemax_cor/max_overlapto retain more, or inspect the funnel (return_stats=True/df_feat.attrs["last_filter_stats"]).Treating ``AUC*`` sign as strength: the sign is direction (which group is higher); the effect size is the magnitude
|AUC*|. Sort on the absolute value.Wrong label coding:
comp_auc_adjusted()needs exactly two integer classes (test=1, reference=0); pass them explicitly vialabel_test/label_refif they differ.Using ``strategy=’frequency’`` without ``fit(use_rfe=True)``: it then keeps every feature (a no-op) and warns.
Next step. Feed the reduced, non-redundant feature set into P8:
Prediction, where the compact subset becomes the input matrix for a
TreeModel and is evaluated with repeated cross-validation.